Is Datadog (DDOG) Pricing Reflect Its Recent Share Price Slide And Mixed Valuation Signals
Datadog DDOG | 120.36 | +1.42% |
- If you are wondering whether Datadog's share price lines up with its business story, or if the stock is pricing in too much hope, you are not alone.
- After a strong multi year run, the stock is now about 12.5% lower year to date, with a 16.7% decline over the last month and a 6.8% drop in the past week, on top of a 15.5% decline over the last year. This reshapes how some investors may be thinking about its risk and return trade off.
- Recent headlines have focused on Datadog's position in cloud based monitoring and observability, as the market reacts to changing expectations for growth across software companies. This context helps explain why the stock's 3 year return of 58.8% and 5 year return of 13.0% now sit alongside more recent share price weakness.
- Our starting point is Datadog's valuation score of 2 out of 6, which suggests the stock screens as undervalued on some checks but not others. Next, we will walk through the main valuation methods and finish with a more rounded way to think about what that score really means.
Datadog scores just 2/6 on our valuation checks. See what other red flags we found in the full valuation breakdown.
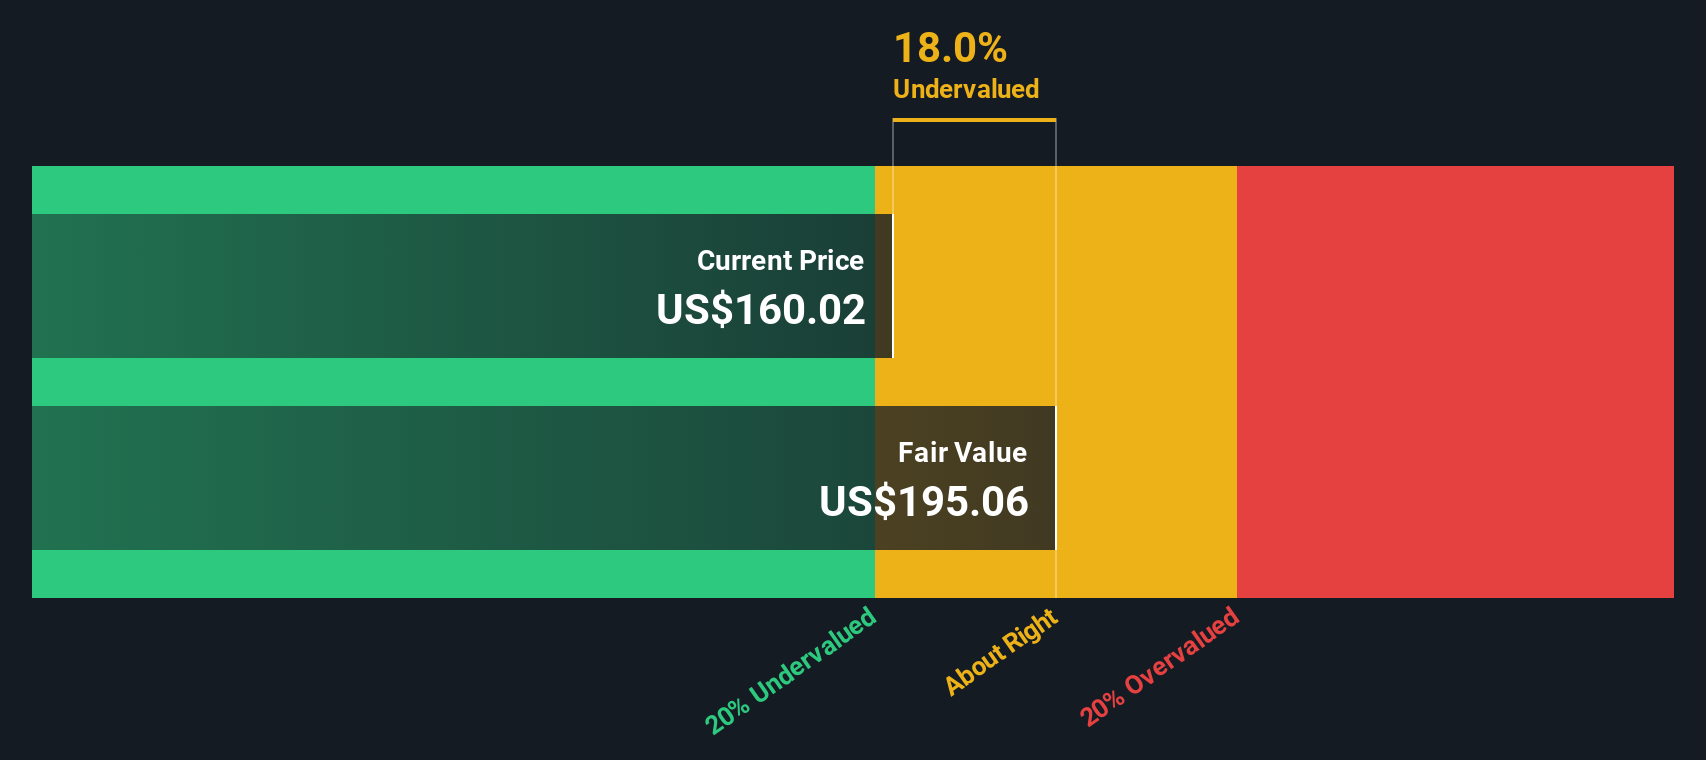
Approach 1: Datadog Discounted Cash Flow (DCF) Analysis
A Discounted Cash Flow, or DCF, model takes estimates of a company's future cash flows and discounts them back to today using a required rate of return. The goal is to arrive at an estimate of what the business may be worth in today's dollars.
For Datadog, the model used is a 2 Stage Free Cash Flow to Equity approach based on cash flow projections. The latest twelve month Free Cash Flow is about $874.3 million. Simply Wall St uses analyst estimates for the earlier years, then extends those projections further out. For example, forecast Free Cash Flow for 2030 is $4.0b, with discounted values provided for each year from 2026 through 2035, all expressed in $.
Putting these projected cash flows together, the DCF model arrives at an estimated intrinsic value of $248.79 per share. That implies the stock is trading at a 53.0% discount to this estimate, which points to Datadog screening as undervalued based on this cash flow view.
Result: UNDERVALUED
Our Discounted Cash Flow (DCF) analysis suggests Datadog is undervalued by 53.0%. Track this in your watchlist or portfolio, or discover 872 more undervalued stocks based on cash flows.
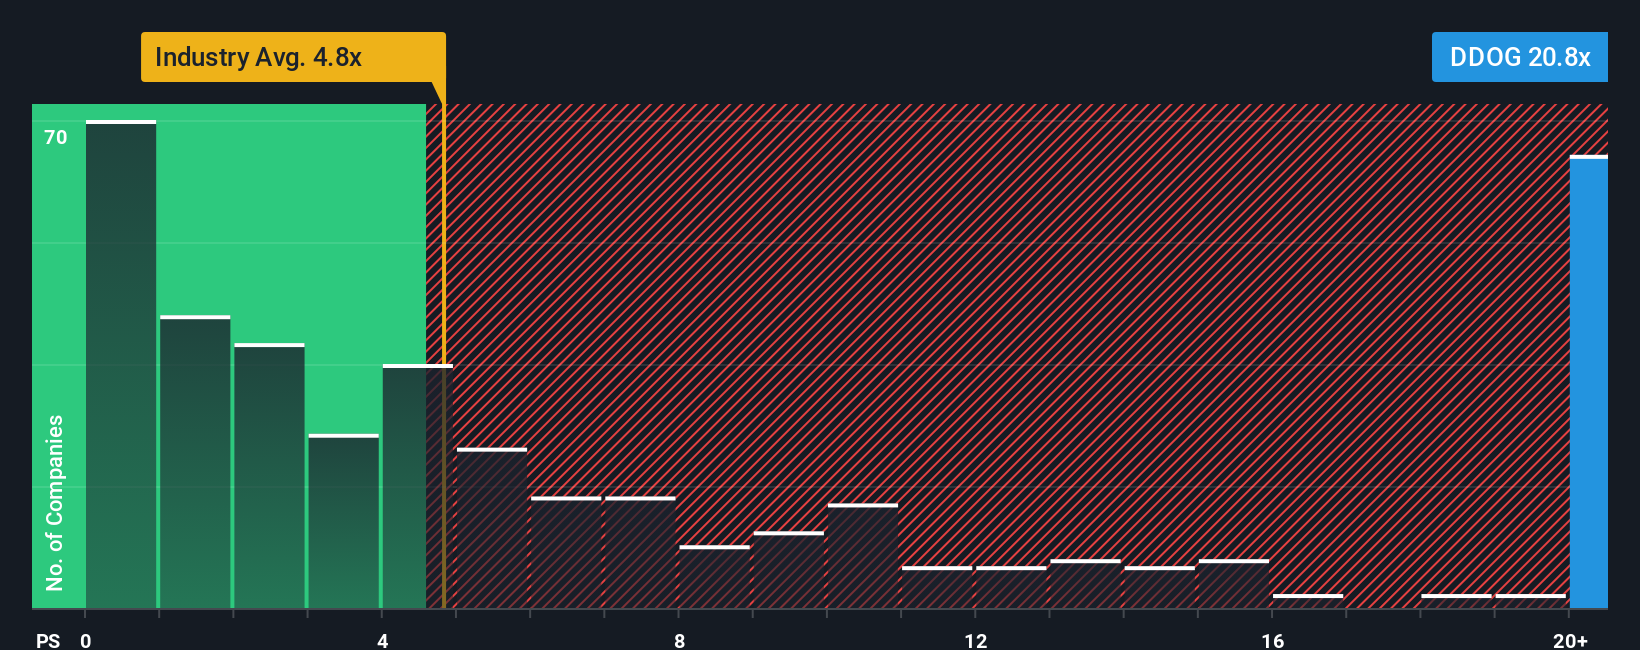
Approach 2: Datadog Price vs Sales
For profitable software companies that are still reinvesting heavily, the P/S ratio is often a useful yardstick because it focuses on what you pay for each dollar of revenue, regardless of how much is currently flowing through to earnings.
Growth expectations and risk both influence what investors usually see as a reasonable multiple, since higher growth potential and lower perceived risk can support a higher P/S, while lower growth or higher risk tend to justify a lower one.
Datadog currently trades on a P/S of 12.77x. That sits above the Software industry average of 4.54x and also above the peer group average of 8.59x. Simply Wall St’s Fair Ratio for Datadog is 12.30x, which is its proprietary estimate of the P/S multiple that would make sense given Datadog’s earnings growth profile, industry, profit margins, market cap and risk characteristics.
This Fair Ratio aims to be more tailored than a simple comparison with peers or industry averages, because it adjusts for company specific factors rather than assuming all software names deserve the same multiple.
Comparing the current 12.77x P/S to the 12.30x Fair Ratio suggests Datadog is slightly above that mark, which points to the stock screening as overvalued on this metric.
Result: OVERVALUED
P/S ratios tell one story, but what if the real opportunity lies elsewhere? Discover 1444 companies where insiders are betting big on explosive growth.
Upgrade Your Decision Making: Choose your Datadog Narrative
Earlier we mentioned that there is an even better way to understand valuation, so let us introduce you to Narratives. Narratives let you attach a clear story to your numbers, including your view of fair value and expectations for Datadog’s future revenue, earnings and margins.
A Narrative links three pieces together: the business story you believe, the financial forecast that follows from that story, and the fair value that results from those assumptions. This allows you to see how your view translates into numbers.
On Simply Wall St’s Community page, Narratives are easy to use. Millions of investors already share their own views there, so you can compare how different fair values, growth assumptions and discount rates stack up against each other.
Once you have a Narrative, the platform compares your Datadog fair value to the current share price to help you consider whether the stock looks closer to a buy, a hold, or a sell for you. It then automatically updates that view when new earnings, news or other data arrive.
For example, some Datadog Narratives on the Community page may assume a very high fair value based on more optimistic growth and margin forecasts, while others may anchor to a much lower fair value with more cautious assumptions.
Do you think there's more to the story for Datadog? Head over to our Community to see what others are saying!

This article by Simply Wall St is general in nature. We provide commentary based on historical data and analyst forecasts only using an unbiased methodology and our articles are not intended to be financial advice. It does not constitute a recommendation to buy or sell any stock, and does not take account of your objectives, or your financial situation. We aim to bring you long-term focused analysis driven by fundamental data. Note that our analysis may not factor in the latest price-sensitive company announcements or qualitative material. Simply Wall St has no position in any stocks mentioned.