Is DLocal (DLO) Pricing Look Interesting After Recent Share Price Weakness?
DLocal Limited DLO | 12.86 | +3.38% |
- If you are wondering whether DLocal's current share price reflects its true worth, you are not alone. The stock raises some clear questions about value that are worth unpacking.
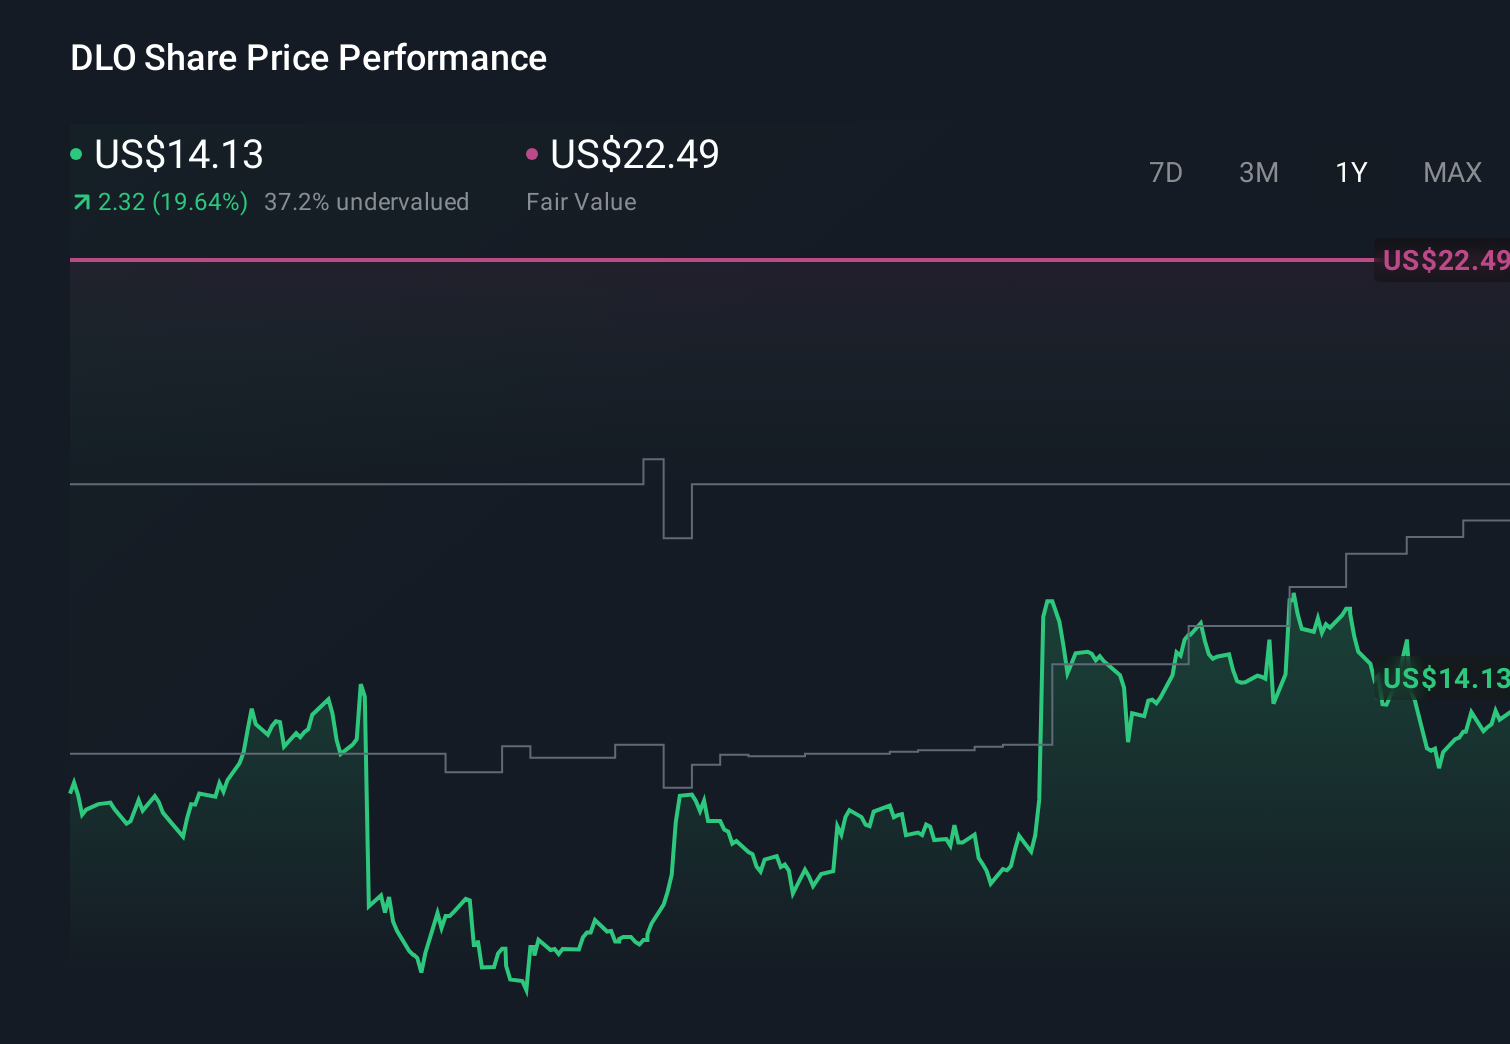
- DLocal recently closed at US$13.18, with returns of a 2.1% decline over 7 days, an 8.0% decline over 30 days, a 6.3% decline year to date, an 8.3% gain over the past year, and a 14.7% decline over 3 years.
- Recently, investors have been reacting to company specific news and broader sentiment around emerging market payments firms. DLocal is often mentioned alongside peers when cross border payment flows and regulatory developments are discussed. This mix of sector commentary and stock specific attention has helped shape how the market is currently pricing DLocal.
- DLocal currently has a valuation score of 4 out of 6, which means it screens as undervalued on four of the six checks used. Next, we will walk through those valuation methods before finishing with a more holistic way to think about what the stock might be worth.
Approach 1: DLocal Excess Returns Analysis
The Excess Returns model asks a simple question: Is DLocal earning more on its equity than it costs the company to provide that equity, and how long can that continue? Instead of focusing on cash flows, it looks at earnings power relative to the capital invested in the business.
For DLocal, the starting point is a Book Value of US$1.71 per share and a Stable Book Value estimate of US$2.78 per share, based on weighted future Book Value estimates from 4 analysts. On that equity base, the model uses a Stable EPS of US$1.18 per share, sourced from weighted future Return on Equity estimates from 6 analysts, and an Average Return on Equity of 42.65%.
The Cost of Equity is set at US$0.25 per share, which implies an Excess Return of US$0.94 per share. The model capitalizes these excess returns to arrive at an intrinsic value of about US$20.09 per share. Compared with the recent share price of US$13.18, this implies that, under the Excess Returns view, the stock is 34.4% undervalued.
Result: UNDERVALUED
Our Excess Returns analysis suggests DLocal is undervalued by 34.4%. Track this in your watchlist or portfolio, or discover 52 more high quality undervalued stocks.

Approach 2: DLocal Price vs Earnings
For a profitable company like DLocal, the P/E ratio is a useful way to relate what you pay for each share to the earnings that the business is currently generating. It gives you a simple anchor, how many dollars of price you are paying for each dollar of earnings.
What counts as a “normal” P/E depends on how quickly earnings are expected to grow and how risky those earnings appear. Higher growth and lower perceived risk can justify a higher multiple, while slower growth or higher uncertainty usually calls for a lower one.
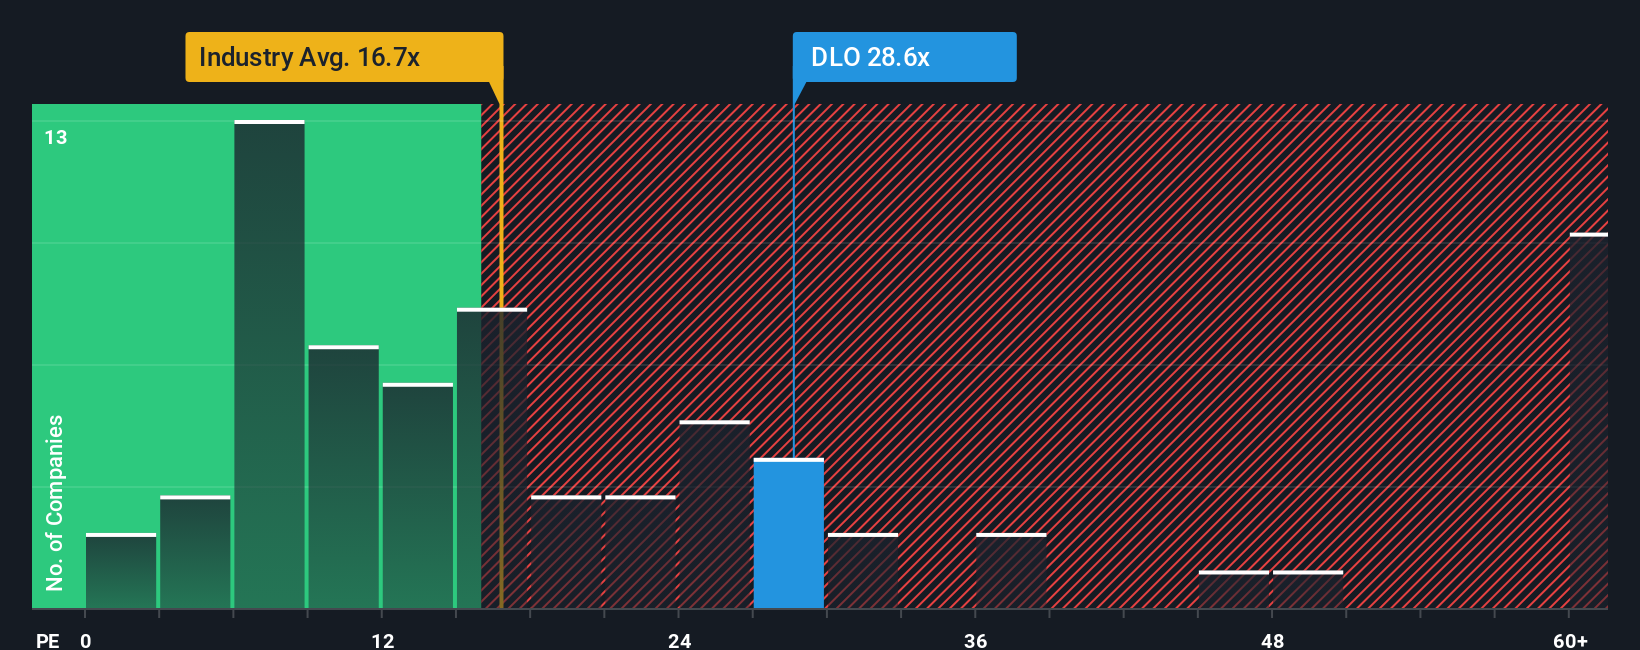
DLocal currently trades on a P/E of 22.72x. That sits above the Diversified Financial industry average of 15.78x, but below a peer average of 53.44x. Simply Wall St also provides a “Fair Ratio” of 21.44x for DLocal, which is the P/E level it estimates would be reasonable given factors like earnings growth, profit margins, industry, market cap and company specific risks.
Compared with simple peer or industry averages, this Fair Ratio aims to be more tailored to DLocal’s own profile rather than a broad group comparison. With the current P/E of 22.72x only modestly above the Fair Ratio of 21.44x, the shares screen as slightly expensive on this metric.
Result: OVERVALUED
P/E ratios tell one story, but what if the real opportunity lies elsewhere? Start investing in legacies, not executives. Discover our 22 top founder-led companies.
Upgrade Your Decision Making: Choose your DLocal Narrative
Earlier we mentioned that there is an even better way to think about valuation, so let us introduce you to Narratives, which connect your view of a company like DLocal with the numbers you plug into a forecast and the fair value that is calculated at the end.
A Narrative is simply your story for the business, written in numbers, where your assumptions about DLocal’s future revenue, earnings and margins are tied directly to an estimate of fair value instead of floating around as loose opinions.
On Simply Wall St, within the Community page that is used by millions of investors, Narratives make this process straightforward by linking a company’s story to a forecast model, calculating a Fair Value, and then helping you compare that Fair Value to today’s share price to decide whether you might consider buying, holding or selling.
Because Narratives on the platform update when fresh information such as news or earnings is added, you can see in real time how different investors respond to the same events. For example, one DLocal Narrative might assume a much higher fair value with stronger margins while another uses more cautious revenue expectations and a lower fair value, leading to very different views on the current price.
Do you think there's more to the story for DLocal? Head over to our Community to see what others are saying!
This article by Simply Wall St is general in nature. We provide commentary based on historical data and analyst forecasts only using an unbiased methodology and our articles are not intended to be financial advice. It does not constitute a recommendation to buy or sell any stock, and does not take account of your objectives, or your financial situation. We aim to bring you long-term focused analysis driven by fundamental data. Note that our analysis may not factor in the latest price-sensitive company announcements or qualitative material. Simply Wall St has no position in any stocks mentioned.