

Is Dollar General (DG) Still Attractive After Mixed Returns And A DCF Value Gap
Dollar General Corporation DG | 0.00 |
- Wondering whether Dollar General at around US$115.82 offers value or risk? This article walks through what the current price might really imply about the stock.
- Recent returns have been mixed, with the share price showing a 6.7% decline over the last 7 days, a 1.1% decline over 30 days, a 15.3% decline year to date, a 26.6% gain over the past year, and longer term 3-year and 5-year returns of 44.0% and 41.9% declines respectively.
- These swings have kept Dollar General firmly on investors' radars, as the stock has moved between periods of renewed interest and more cautious sentiment. While there is no single headline driving all of these moves, the mix of recent gains and longer term declines has raised fresh questions about what counts as a reasonable price today.
- According to Simply Wall St's valuation checks, Dollar General currently has a valuation score of 6 out of 6. The next sections break down how different valuation methods arrive at that result, then finish with a broader way to think about what valuation really means for your investment approach.
Approach 1: Dollar General Discounted Cash Flow (DCF) Analysis
A Discounted Cash Flow, or DCF, model looks at the cash Dollar General is expected to generate in the future, then discounts those projections back into today’s dollars to estimate what the business might be worth right now.
Dollar General’s latest twelve month Free Cash Flow is about $2.1b. Analyst and model projections extend this further, with Simply Wall St using a 2 Stage Free Cash Flow to Equity model. For example, projected Free Cash Flow for 2031 is around $2.0b, and the model includes a series of annual forecasts and extrapolated estimates through 2035, all expressed in $ and discounted back to today.
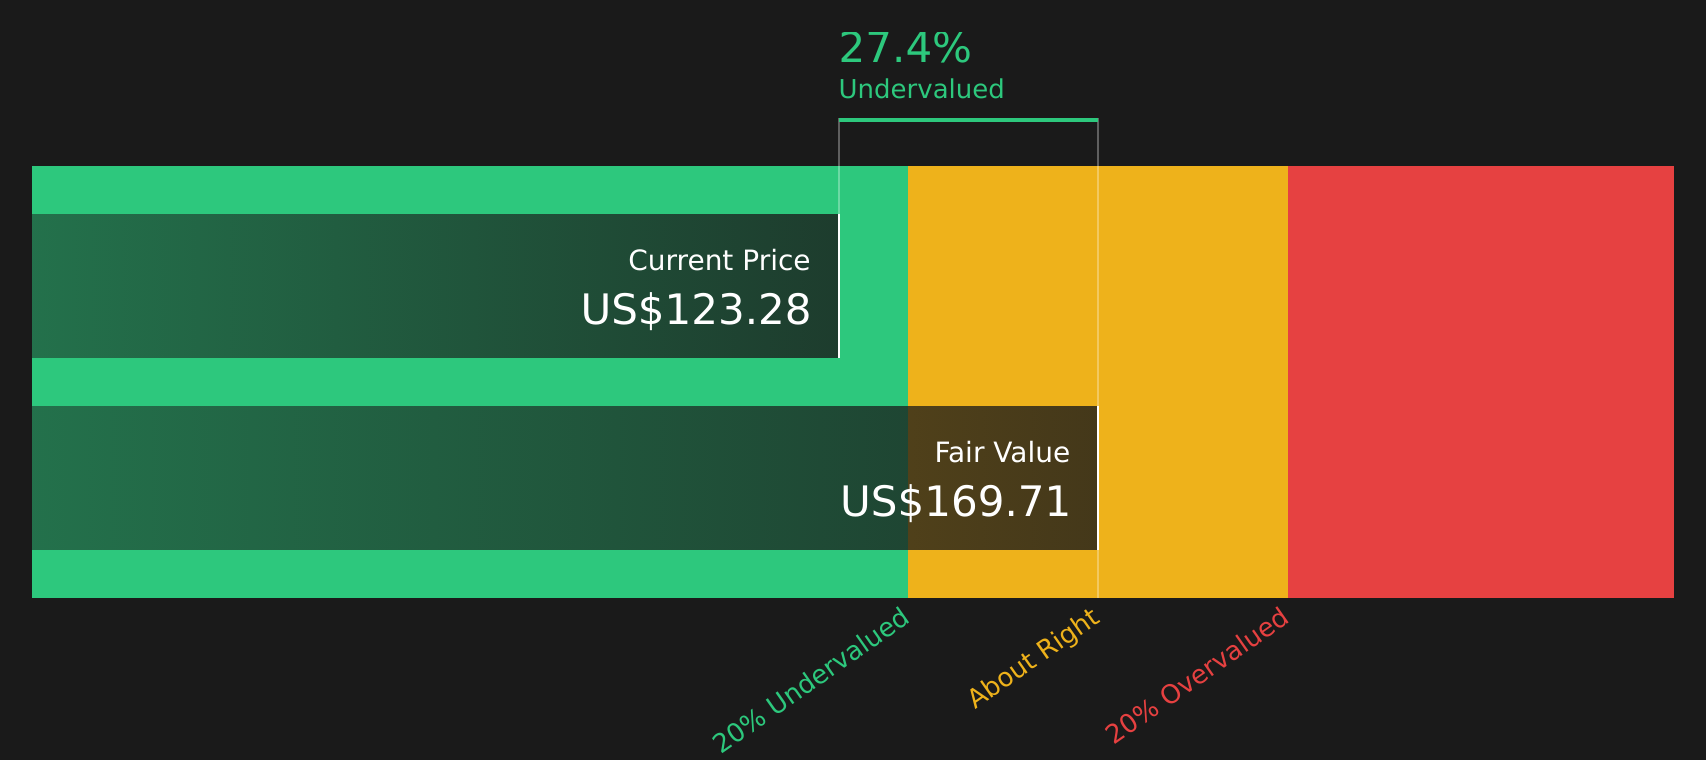
Bringing these discounted cash flows together gives an estimated intrinsic value of about $170.72 per share. Against a current share price around $115.82, the DCF output implies the stock trades at roughly a 32.2% discount to that estimate, which indicates Dollar General appears undervalued based on this model alone.
Result: UNDERVALUED
Our Discounted Cash Flow (DCF) analysis suggests Dollar General is undervalued by 32.2%. Track this in your watchlist or portfolio, or discover 53 more high quality undervalued stocks.
Approach 2: Dollar General Price vs Earnings
For profitable companies, the P/E ratio is a practical way to think about valuation because it links what you pay per share to the earnings that support that share price. A higher P/E usually reflects stronger growth expectations or lower perceived risk, while a lower P/E can point to more modest growth assumptions or higher uncertainty.
Dollar General currently trades on a P/E of 16.87x. That sits below the Consumer Retailing industry average P/E of about 18.36x and the peer group average of about 20.69x, so the market is pricing Dollar General at a discount to both its sector and direct comparisons.
Simply Wall St’s Fair Ratio for Dollar General is 20.94x. This is a proprietary estimate of what the P/E might be given factors such as the company’s earnings growth profile, profit margins, risk indicators, industry, and market capitalization. Because it blends these company specific inputs, the Fair Ratio can be a more tailored benchmark than a simple industry or peer average. Comparing the Fair Ratio of 20.94x with the current P/E of 16.87x indicates that the shares are trading below that modeled level.
Result: UNDERVALUED

P/E ratios tell one story, but what if the real opportunity lies elsewhere? Start investing in legacies, not executives. Discover our 18 top founder-led companies.
Upgrade Your Decision Making: Choose your Dollar General Narrative
Earlier it was mentioned that there is an even better way to understand valuation, so Narratives are a simple way for you to attach a story about Dollar General to the numbers, by linking your view of its future revenue, earnings and margins to a financial forecast and then to a Fair Value that you can compare with today’s price.
On Simply Wall St’s Community page, Narratives are available as an easy tool used by millions of investors. This means you can see different Fair Values for Dollar General side by side and quickly judge whether each story suggests the stock is priced above or below that estimate at around US$115.82.
For example, one optimistic Narrative currently aligns with a Fair Value of US$175.0, while a more cautious Narrative points closer to US$116.63. Both are automatically refreshed when new earnings, guidance or news are added, which helps you decide which story you agree with and how that lines up against the current share price.
Do you think there's more to the story for Dollar General? Head over to our Community to see what others are saying!

This article by Simply Wall St is general in nature. We provide commentary based on historical data and analyst forecasts only using an unbiased methodology and our articles are not intended to be financial advice. It does not constitute a recommendation to buy or sell any stock, and does not take account of your objectives, or your financial situation. We aim to bring you long-term focused analysis driven by fundamental data. Note that our analysis may not factor in the latest price-sensitive company announcements or qualitative material. Simply Wall St has no position in any stocks mentioned.