Is Duke Energy (DUK) Fairly Priced After Mixed Dividend And Earnings Signals?
Duke Energy Corporation DUK | 132.22 | +1.01% |
- If you are wondering whether Duke Energy's current share price reflects its true worth, you are not alone. Many investors are trying to work out what a fair value looks like for this utility stock.
- Duke Energy's share price closed at US$117.32, with returns of 0.1% over the past week, 1.8% over the past month, a slight 0.1% decline year to date, and 12.3%, 25.7% and 55.7% over the last 1, 3 and 5 years respectively.
- Recent attention on Duke Energy has included ongoing discussion around the role of regulated utilities in income focused portfolios and how interest rate expectations can influence investor appetite for dividend payers. These factors have helped frame how investors interpret the share price moves seen over the short and longer term.
- On our checks, Duke Energy currently scores 3/6 for value, which suggests some areas look attractive while others are more mixed. Next, we will walk through the usual valuation yardsticks before finishing with a more holistic way to think about what the stock might be worth.
Approach 1: Duke Energy Dividend Discount Model (DDM) Analysis
The Dividend Discount Model estimates what a share could be worth by projecting future dividends and discounting them back to today. It is essentially asking what a stream of Duke Energy dividends is worth in present dollar terms.
For Duke Energy, the model uses a current dividend per share of about US$4.59, a return on equity of 8.80% and a payout ratio of roughly 101.89%. That payout ratio suggests the company is paying out slightly more than its calculated earnings, so the implied dividend growth from the model is marginally negative at around 0.17% a year. The growth input is calculated as the product of the retention ratio and return on equity, described as “Calculated (1 - Payout Ratio) x ROE, (1 - 101.89%) x 8.80%).”
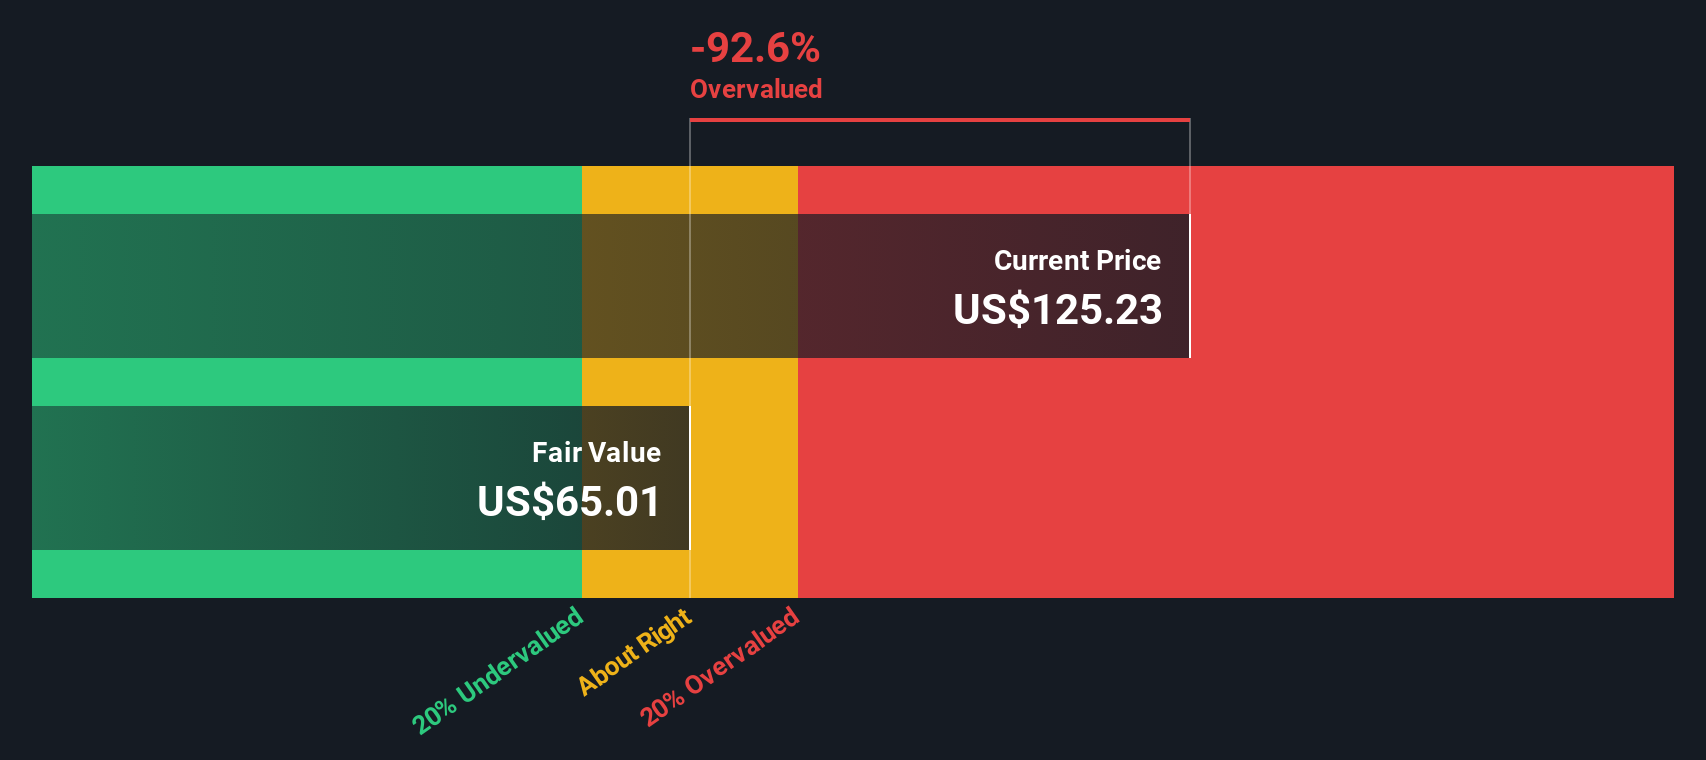
Based on these assumptions, the DDM output for Duke Energy points to an estimated intrinsic value of about US$64.38 per share. Compared with the recent share price of US$117.32, this DDM result implies the stock is around 82.2% overvalued on this measure alone.
Result: OVERVALUED
Our Dividend Discount Model (DDM) analysis suggests Duke Energy may be overvalued by 82.2%. Discover 871 undervalued stocks or create your own screener to find better value opportunities.
Approach 2: Duke Energy Price vs Earnings
For a profitable company like Duke Energy, the P/E ratio is a useful way to think about what you are paying for each dollar of current earnings. It ties the share price directly to the business’s ability to generate profit, which is what ultimately underpins dividends and reinvestment.
What counts as a “normal” P/E depends on how the market views a company’s growth prospects and risk. Higher expected growth or lower perceived risk can support a higher P/E, while slower growth or higher risk often goes with a lower P/E.
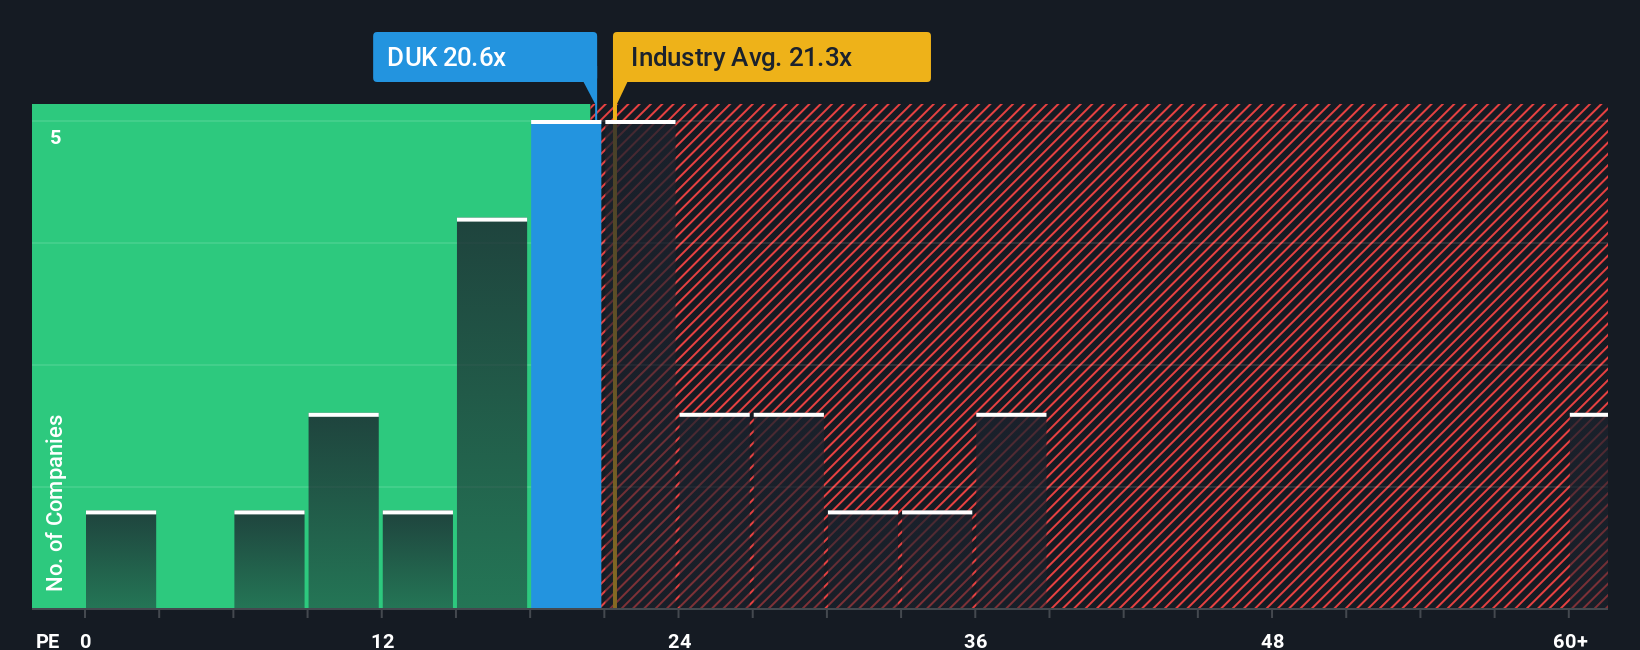
Duke Energy currently trades on a P/E of 18.54x. That sits slightly below the Electric Utilities industry average of about 19.89x and below the broader peer average of 25.17x. Simply Wall St’s Fair Ratio for Duke Energy is 22.65x, which is its proprietary estimate of what a reasonable P/E could be given factors such as the company’s earnings profile, industry, profit margins, size and risk characteristics.
The Fair Ratio aims to be more tailored than a simple comparison with industry or peer averages because it adjusts for Duke Energy’s own growth outlook, risks, profitability, sector and market cap. Set against the current P/E of 18.54x, the Fair Ratio of 22.65x suggests the shares screen as undervalued on this metric.
Result: UNDERVALUED
P/E ratios tell one story, but what if the real opportunity lies elsewhere? Discover 1444 companies where insiders are betting big on explosive growth.
Upgrade Your Decision Making: Choose your Duke Energy Narrative
Earlier we mentioned that there is an even better way to understand valuation, so let us introduce you to Narratives. With Narratives, you set out your story for Duke Energy, link that story to your assumptions for future revenue, earnings and margins, and the platform turns it into a financial forecast with a fair value. You can compare this fair value directly to today’s price, track it on Simply Wall St’s Community page, and see it update automatically as new earnings or news arrive. For example, one investor might plug in the current analyst-style fair value of about US$136.35 per share based on assumptions like 5.03% annual revenue growth, a 16.68% profit margin and a future P/E of 21.58x. A more cautious investor could choose a lower fair value using weaker growth or margin assumptions. Both Narratives would sit side by side so you can see how your view on Duke Energy differs and what that means for whether the current price looks high or low to you.
Do you think there's more to the story for Duke Energy? Head over to our Community to see what others are saying!

This article by Simply Wall St is general in nature. We provide commentary based on historical data and analyst forecasts only using an unbiased methodology and our articles are not intended to be financial advice. It does not constitute a recommendation to buy or sell any stock, and does not take account of your objectives, or your financial situation. We aim to bring you long-term focused analysis driven by fundamental data. Note that our analysis may not factor in the latest price-sensitive company announcements or qualitative material. Simply Wall St has no position in any stocks mentioned.