Is DuPont De Nemours (DD) Still Attractively Priced After Its Strong One Year Share Price Run?
E. I. du Pont de Nemours and Company DD | 45.48 | -1.58% |
- If you are wondering whether DuPont de Nemours shares still offer value at around US$51.07, it helps to step back and look at what the current price might be implying about the business.
- The stock has returned 0.4% over the last 7 days, 15.7% over the past month, 25.0% year to date and 52.3% over the past year, with longer term returns of 76.8% over 3 years and 83.4% over 5 years.
- Recent news around DuPont has focused on the company's portfolio positioning and its place in the broader materials sector, which helps frame how investors think about both its risks and prospects. This context is important when you look at a share price that has moved meaningfully over multi year periods, as it can shape expectations that feed into current valuations.
- On Simply Wall St's 6 point valuation check, DuPont currently scores 1 out of 6. We will walk through traditional valuation approaches next and then finish with a different way of thinking about value that can tie these methods together.
DuPont de Nemours scores just 1/6 on our valuation checks. See what other red flags we found in the full valuation breakdown.
Approach 1: DuPont de Nemours Discounted Cash Flow (DCF) Analysis
A Discounted Cash Flow, or DCF, model takes estimates of a company’s future cash flows and discounts them back to today’s dollars. This aims to show what the business might be worth right now based on those projected cash flows.
For DuPont de Nemours, the model used is a 2 Stage Free Cash Flow to Equity approach. The latest twelve month free cash flow stands at about $1.09b. Analysts provide explicit forecasts for several years, and Simply Wall St extrapolates beyond that, with free cash flow in 2029 projected at $1.12b and further estimates extending out to 2035. All of these future cash flows are discounted back to today in dollars to arrive at an overall estimate of value.
On this basis, the DCF model suggests an intrinsic value of around $59.64 per share, compared with the recent share price of roughly $51.07. That implies the shares are about 14.4% below this model’s estimate of fair value, which suggests DuPont may be trading at a discount under these assumptions.
Result: UNDERVALUED
Our Discounted Cash Flow (DCF) analysis suggests DuPont de Nemours is undervalued by 14.4%. Track this in your watchlist or portfolio, or discover 51 more high quality undervalued stocks.

Approach 2: DuPont de Nemours Price vs Sales
For companies that are generating revenue and operating at scale, the P/S ratio can be a helpful way to think about what you are paying for each dollar of sales, especially when earnings can be affected by one off items or accounting treatments.
In broad terms, higher growth expectations and lower perceived risk tend to support a higher “normal” or “fair” P/S multiple. Slower growth and higher uncertainty usually point to a lower one. That context matters when you line DuPont up against its sector.
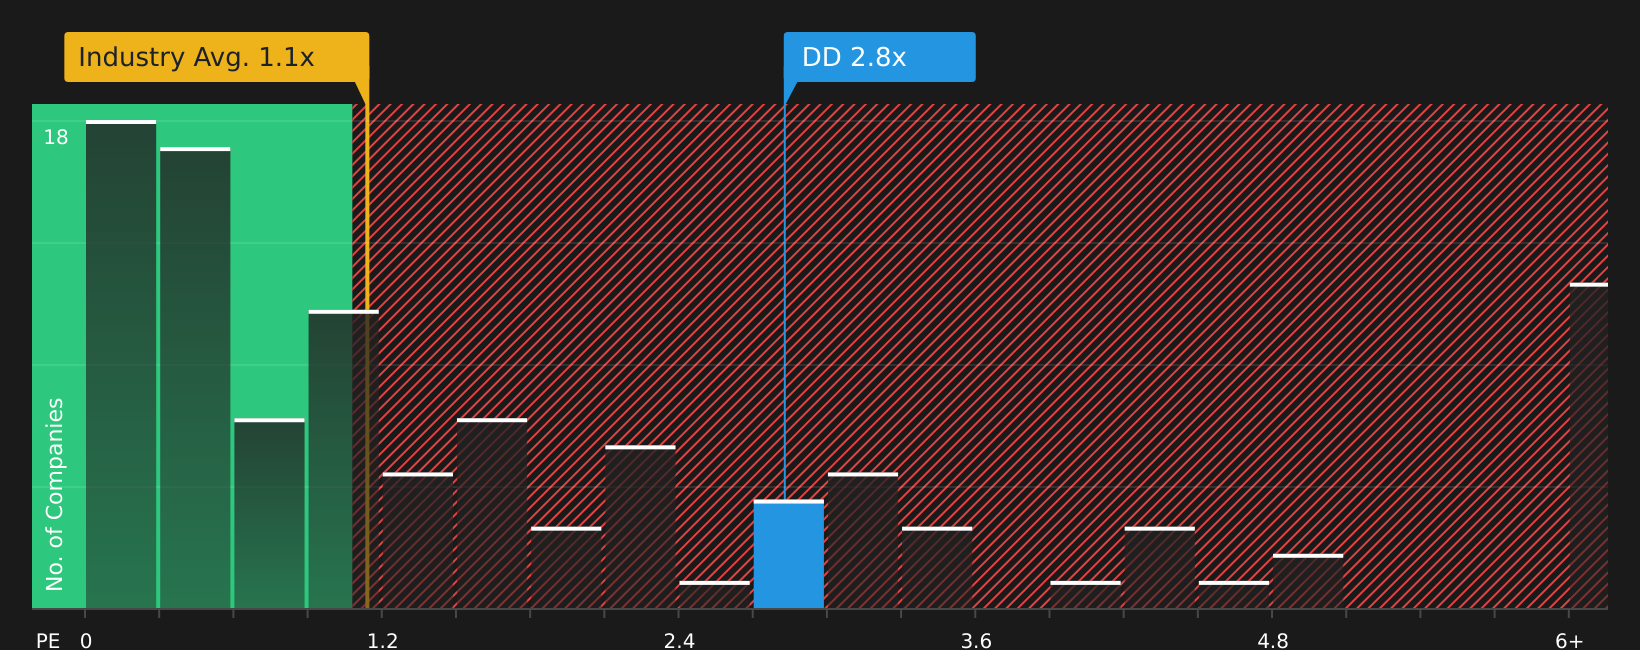
DuPont currently trades on a P/S of 3.05x. This sits above the Chemicals industry average of 1.19x and above the peer group average of 2.49x. Simply Wall St also calculates a proprietary “Fair Ratio” for DuPont of 2.25x. This Fair Ratio is designed to reflect the P/S multiple you might expect given factors such as the company’s earnings growth profile, its industry, profit margins, market cap and key risks.
Because the Fair Ratio incorporates these company specific drivers, it can be more informative than a simple comparison with peers or the broader industry. Set against the current P/S of 3.05x, DuPont screens as trading above this Fair Ratio.
Result: OVERVALUED
P/S ratios tell one story, but what if the real opportunity lies elsewhere? Start investing in legacies, not executives. Discover our 22 top founder-led companies.
Upgrade Your Decision Making: Choose your DuPont de Nemours Narrative
Earlier we mentioned that there is an even better way to understand valuation, so let us introduce Narratives. With Narratives, you tell the story you see for DuPont de Nemours, connect that story to your own assumptions for future revenue, earnings, margins and fair value, and then compare that fair value with the current price. All of this happens within an easy tool on Simply Wall St's Community page that updates as new news or earnings arrive. One investor might lean toward a higher fair value closer to the most bullish analyst target of US$113 if they think AI, healthcare and water products support stronger growth. Another might anchor on a lower fair value around US$44 if they are more focused on PFAS liabilities and regulatory risks. Narratives makes both perspectives visible, comparable and practical for deciding whether the current share price lines up with your view.
For DuPont de Nemours however, we will make it really easy for you with previews of two leading DuPont de Nemours Narratives:
Fair value: US$56.13 per share
Implied discount vs last close: about 9.0% below this narrative fair value
Revenue growth assumption: 3.8% a year
- Focuses on growth in Electronics and Healthcare & Water, where demand for AI related electronics, clean water and medical materials is expected to support revenue and margin stability.
- Assumes portfolio refocusing and an active product pipeline, such as new water and healthcare materials, help support higher earnings stability and improved cash flow visibility.
- Highlights that legal, operational and geopolitical risks, including PFAS litigation and exposure to China, remain important factors that could affect cash flows and profitability.
Fair value: US$44.00 per share
Implied premium vs last close: about 16.1% above this narrative fair value
Revenue growth assumption: 16.1% annual decline
- Emphasises rising environmental and ESG related costs, including PFAS and other remediation obligations, as a long term drag on margins and earnings growth.
- Points to regulatory complexity, trade barriers and higher input costs as ongoing headwinds for revenue, supply chains and profitability.
- Assumes that even with exposure to higher growth segments, portfolio changes and industry capacity could limit DuPont's ability to sustain margin gains and share price strength.
If you want to see how other investors are joining the dots between these bullish and bearish cases, 📊 Read the what the Community is saying about DuPont de Nemours. can help you compare how the different fair values, risks and assumptions stack up against the current DuPont de Nemours share price.
Do you think there's more to the story for DuPont de Nemours? Head over to our Community to see what others are saying!

This article by Simply Wall St is general in nature. We provide commentary based on historical data and analyst forecasts only using an unbiased methodology and our articles are not intended to be financial advice. It does not constitute a recommendation to buy or sell any stock, and does not take account of your objectives, or your financial situation. We aim to bring you long-term focused analysis driven by fundamental data. Note that our analysis may not factor in the latest price-sensitive company announcements or qualitative material. Simply Wall St has no position in any stocks mentioned.