

Is Enerpac Tool Group (EPAC) Fairly Valued After Its Dividend News And Accounting Change?
Enerpac Tool Group Corp Class A EPAC | 0.00 |
Enerpac Tool Group (EPAC) recently attracted investor attention after its board declared an annual cash dividend of $0.04 per share and approved a leadership change in the principal accounting officer role.
Recent news around Enerpac Tool Group, including the dividend declaration and the upcoming Investor Day at the New York Stock Exchange on 4 November 2026, comes as momentum has picked up again. The share price is at US$37.09, with a 1 day share price return of 6.34% and a 7 day share price return of 9.31%. The year to date share price return is down 6.24% and the 5 year total shareholder return is 45.07%.
If you are comparing Enerpac Tool Group with other opportunities in industrial tools, this can be a good moment to broaden your watchlist and check out 34 power grid technology and infrastructure stocks
After a sharp move to US$37.09 and with Enerpac Tool Group trading below both analyst targets and some intrinsic estimates, is the market being fairly cautious or undervaluing what the current numbers suggest?
Price to earnings of 20.3x for Enerpac Tool Group: Is it justified?
Enerpac Tool Group currently trades on a P/E of 20.3x, which screens as good value compared with its peers and industry, while the last close sits at $37.09.
The P/E multiple compares the company’s share price with its earnings per share, so it gives a quick snapshot of how much the market is paying for each dollar of profit. For an industrial tools business like Enerpac Tool Group, this is a commonly watched yardstick because the company is already profitable and has a track record of earnings growth.
Enerpac Tool Group is considered good value on this measure when stacked against several benchmarks. The current P/E of 20.3x is below the estimated fair P/E of 20.5x. This points to a level that the market could reasonably move towards if expectations align with that fair ratio. It also sits below the US Machinery industry average P/E of 28.2x and well below the peer group average of 49.3x. Those gaps suggest investors are paying a lower price for Enerpac Tool Group’s earnings than for many comparable stocks, even though earnings are forecast to grow and net profit margins currently stand at 14.7%.
Result: Price-to-earnings of 20.3x (UNDERVALUED)
However, Enerpac Tool Group still faces risks if earnings or margins soften from current levels, or if investor sentiment cools after the recent share price jump.
Another view on Enerpac Tool Group using our DCF model
The P/E ratio hints that Enerpac Tool Group looks inexpensive, and the SWS DCF model values the stock above the current $37.09 share price. At an estimated future cash flow value of $43.89, the stock trades at a 15.5% discount. Could this gap reflect caution about future growth assumptions?
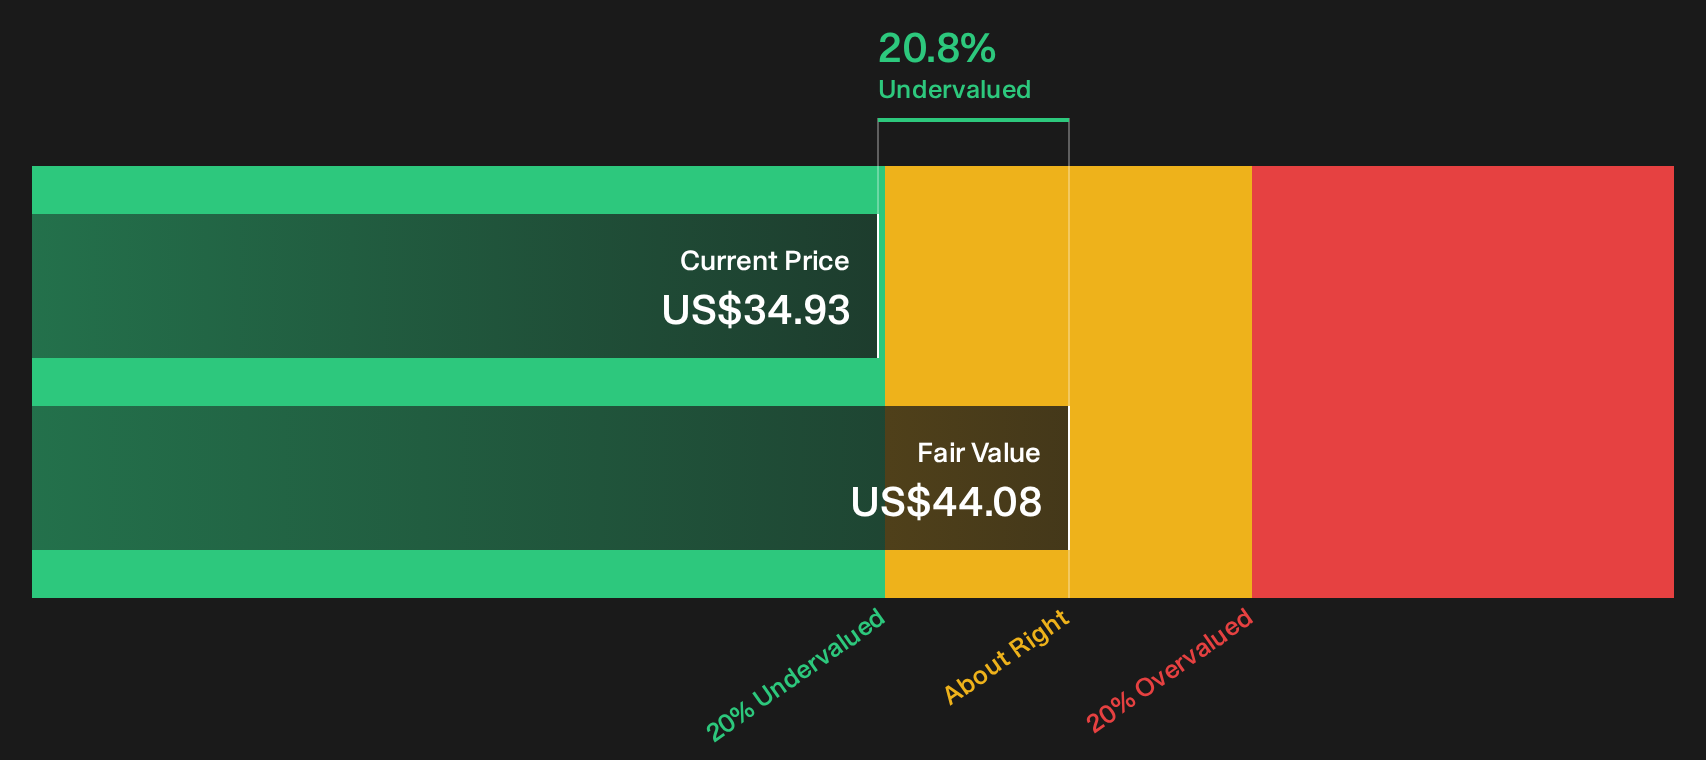
Simply Wall St performs a discounted cash flow (DCF) on every stock in the world every day (check out Enerpac Tool Group for example). We show the entire calculation in full. You can track the result in your watchlist or portfolio and be alerted when this changes, or use our stock screener to discover 49 high quality undervalued stocks. If you save a screener we even alert you when new companies match - so you never miss a potential opportunity.
Next Steps
If the mixed signals around Enerpac Tool Group leave you uncertain, check the data yourself and decide quickly what it means for your portfolio with 4 key rewards.
Looking for more investment ideas beyond Enerpac Tool Group?
Enerpac Tool Group may already be on your radar, but you do not want to miss other opportunities that could balance your portfolio and sharpen your edge.
- Spot potential value opportunities early and compare them with Enerpac Tool Group by scanning the market using 49 high quality undervalued stocks.
- Strengthen your focus on financial resilience and reduce unpleasant surprises by filtering for companies through the solid balance sheet and fundamentals stocks screener (48 results).
- Hunt for underfollowed opportunities that the crowd may be missing by checking the screener containing 20 high quality undiscovered gems.
This article by Simply Wall St is general in nature. We provide commentary based on historical data and analyst forecasts only using an unbiased methodology and our articles are not intended to be financial advice. It does not constitute a recommendation to buy or sell any stock, and does not take account of your objectives, or your financial situation. We aim to bring you long-term focused analysis driven by fundamental data. Note that our analysis may not factor in the latest price-sensitive company announcements or qualitative material. Simply Wall St has no position in any stocks mentioned.