Is EQT (EQT) Still Attractively Priced After Strong Multi Year Share Price Gains
EQT Corporation EQT | 58.39 | +2.87% |
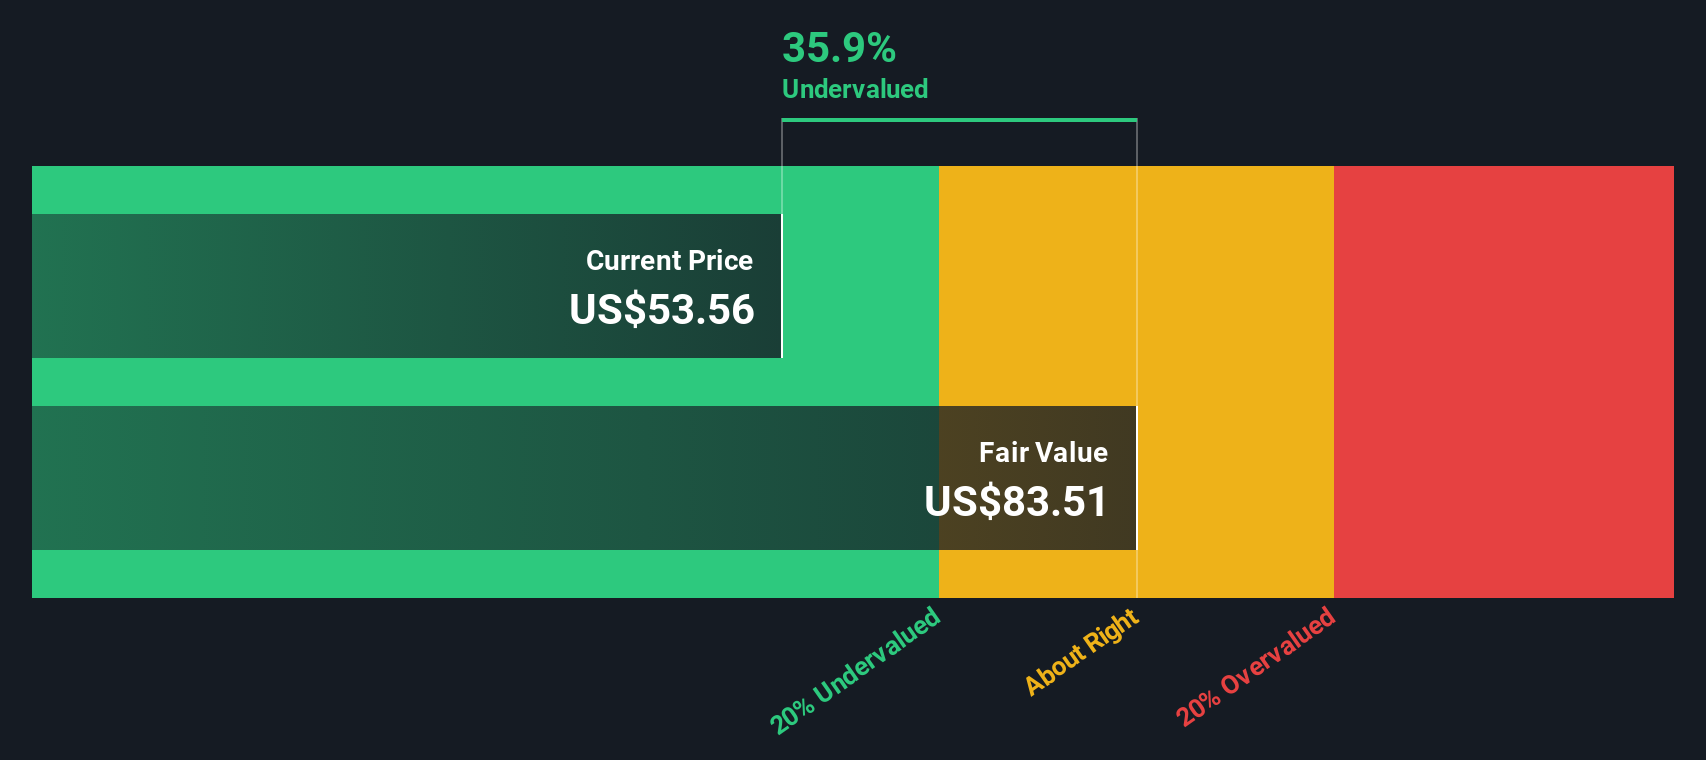
- If you are trying to figure out whether EQT is attractively priced or getting ahead of itself, the current share price of US$56.79 makes valuation a key question.
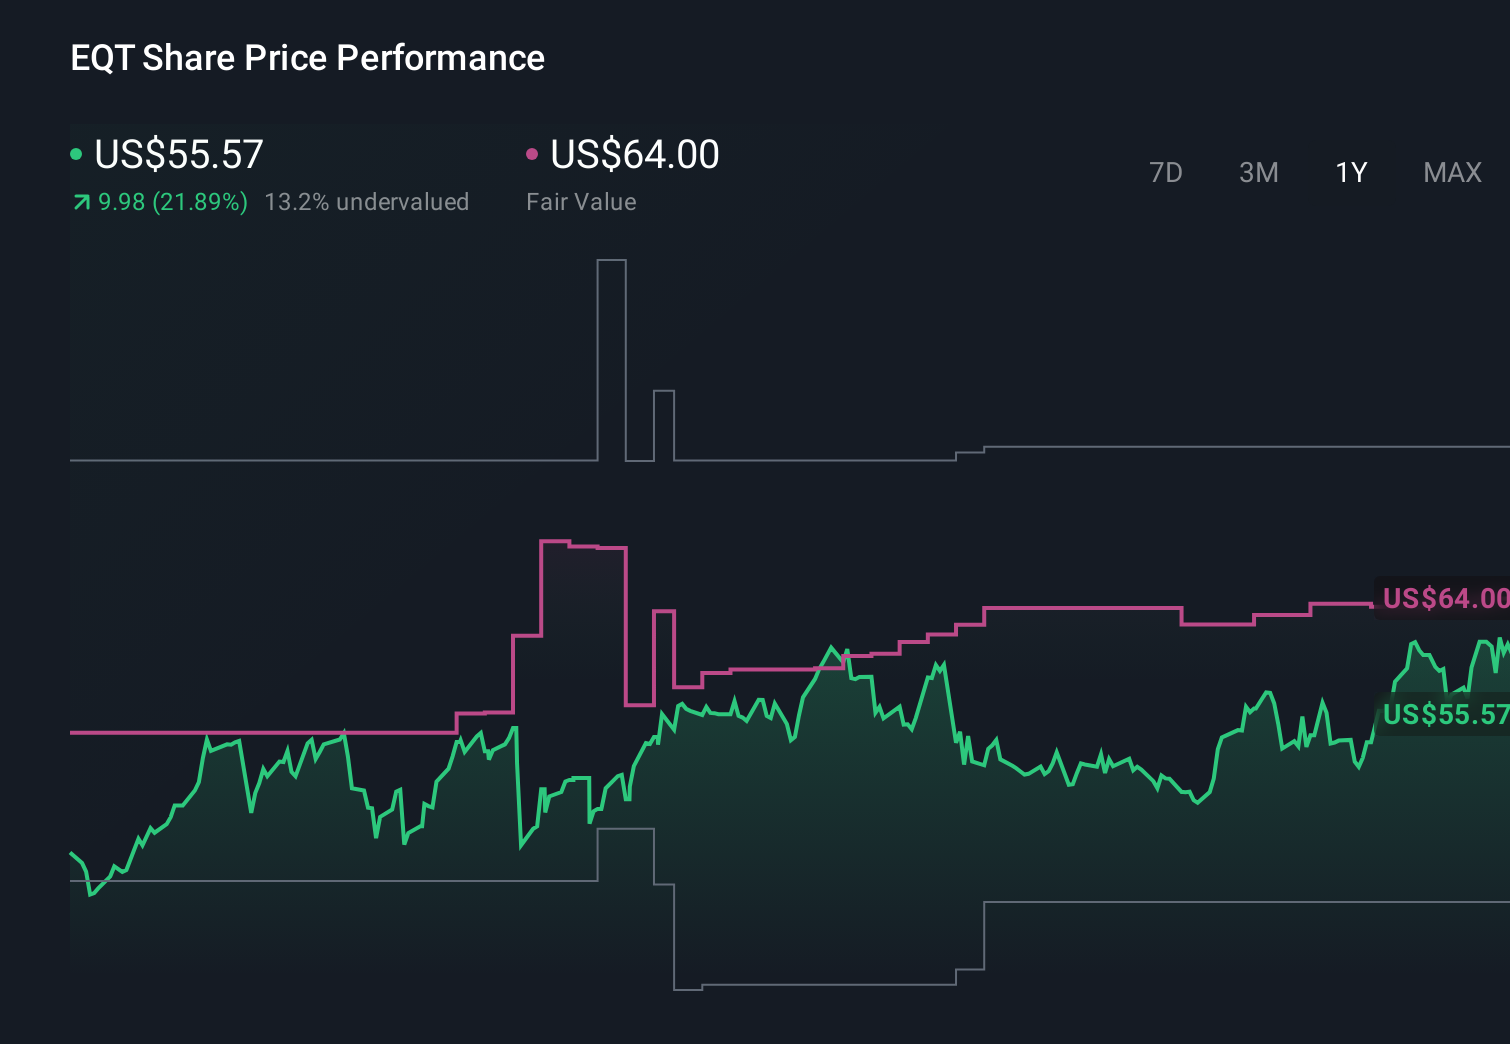
- The stock has been relatively active, with a 1 week return of a 1.6% decline, a 30 day return of 11.2%, a year to date return of 6.2%, a 1 year return of 12.4% and a very large 5 year return that is around 2.4x.
- Recent coverage around EQT has focused on its role in the US energy sector and how natural gas focused businesses are positioned in current commodity markets. This background helps frame why the share price has moved over different time frames and why investors are watching valuation closely.
- On our checks, EQT has a valuation score of 3 out of 6. Next we will look at what different valuation approaches suggest about the stock today, while also pointing you to a more complete way to think about value at the end of the article.
Approach 1: EQT Discounted Cash Flow (DCF) Analysis
A Discounted Cash Flow, or DCF, model looks at the cash EQT is expected to generate in the future and then discounts those cash flows back to today to estimate what the business might be worth in $ right now.
For EQT, the model used is a 2 Stage Free Cash Flow to Equity approach. The latest twelve month free cash flow is about $2.13b. Analysts provide free cash flow estimates for the next few years, and beyond that the projections out to 2035 are extrapolated using Simply Wall St assumptions. By 2030, the projected free cash flow used in the model is $3.07b, with each future year discounted back to today to reflect risk and the time value of money.
Adding up all those discounted cash flows gives an estimated intrinsic value of US$105.12 per share. Against the current share price of US$56.79, this implies that EQT is about 46.0% undervalued on this DCF view.
Result: UNDERVALUED
Our Discounted Cash Flow (DCF) analysis suggests EQT is undervalued by 46.0%. Track this in your watchlist or portfolio, or discover 52 more high quality undervalued stocks.
Approach 2: EQT Price vs Earnings (P/E)
For profitable companies, the P/E ratio is a useful gauge because it links what you pay for each share to the earnings that business is currently generating. It gives you a quick sense of how many dollars investors are paying for one dollar of earnings.
What counts as a “normal” P/E depends on how the market views a company’s growth potential and risk profile. Higher expected growth or lower perceived risk can support a higher P/E, while slower growth or higher risk usually lines up with a lower P/E.
EQT currently trades on a P/E of 19.9x. That sits above the Oil and Gas industry average of 14.1x and also above the peer group average of 16.4x, so on simple comparisons the shares are pricing in stronger characteristics than many peers. Simply Wall St’s Fair Ratio for EQT is 23.6x, which is a proprietary estimate of what the P/E might be given factors such as earnings growth, industry, profit margins, market cap and key risks.
This Fair Ratio can be more informative than a plain peer or industry comparison because it attempts to adjust for EQT’s specific profile rather than treating all companies as equal. With the current P/E of 19.9x sitting below the Fair Ratio of 23.6x, this approach suggests that EQT may be undervalued on an earnings basis.
Result: UNDERVALUED

P/E ratios tell one story, but what if the real opportunity lies elsewhere? Start investing in legacies, not executives. Discover our 22 top founder-led companies.
Upgrade Your Decision Making: Choose your EQT Narrative
Earlier we mentioned that there is an even better way to understand valuation, so let us introduce you to Narratives, a simple tool that lets you attach a clear story about EQT to your own assumptions for fair value, future revenue, earnings and margins.
A Narrative links three things in one place: the company story you believe in, the financial forecast that follows from that story, and the fair value estimate that drops out of those numbers.
You can build and explore Narratives directly on Simply Wall St’s Community page. There, millions of investors share their views, compare Fair Value to the current price to decide whether EQT looks interesting to them, and then see those Narratives automatically refreshed when new information like results or news is added to the platform.
For EQT, one investor might use a Narrative that points to a higher fair value based on stronger assumptions for future earnings, while another might settle on a much lower fair value because they expect more moderate revenue and margins from the business.
Do you think there's more to the story for EQT? Head over to our Community to see what others are saying!
This article by Simply Wall St is general in nature. We provide commentary based on historical data and analyst forecasts only using an unbiased methodology and our articles are not intended to be financial advice. It does not constitute a recommendation to buy or sell any stock, and does not take account of your objectives, or your financial situation. We aim to bring you long-term focused analysis driven by fundamental data. Note that our analysis may not factor in the latest price-sensitive company announcements or qualitative material. Simply Wall St has no position in any stocks mentioned.