Is Exxon Mobil (XOM) Still Attractive After Its Recent Share Price Strength?
Exxon Mobil Corporation XOM | 160.69 | -0.06% |
- If you are wondering whether Exxon Mobil's share price reflects its true worth, this article walks through the key numbers that matter without the noise.
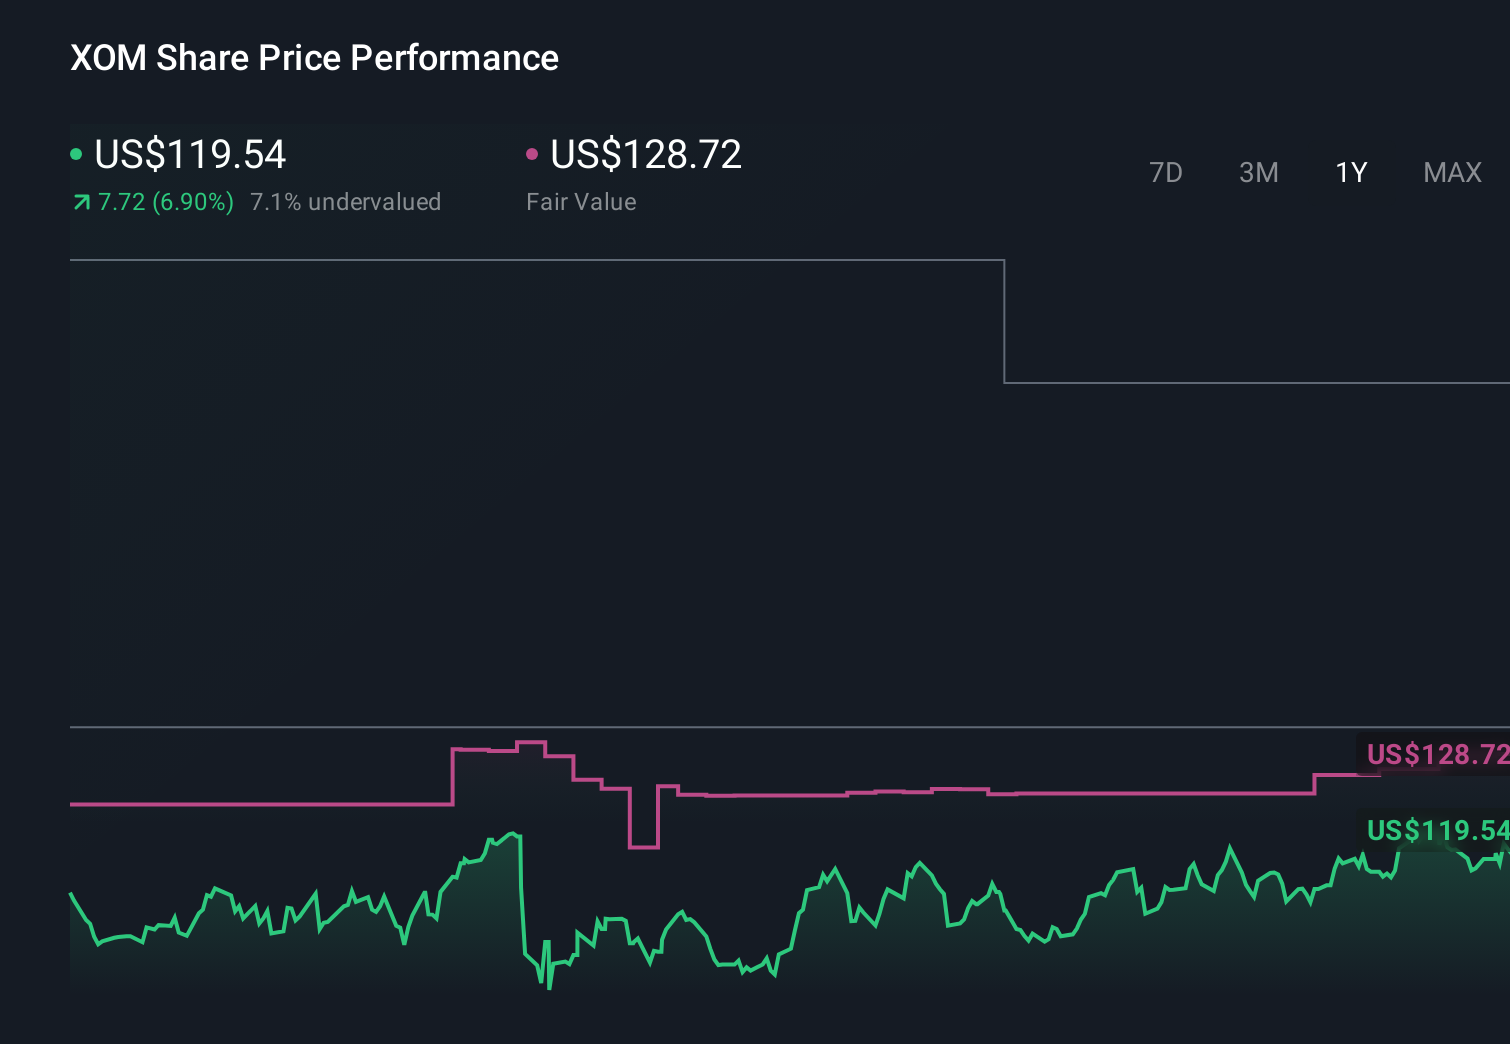
- With the stock at US$133.64 and returns of 3.5% over 7 days, 11.9% over 30 days, 9.0% year to date, 25.8% over 1 year and a very large 5 year return, many investors are asking what is already priced in.
- Recent coverage around Exxon's long term capital plans, energy transition positioning and large scale project pipeline has helped keep attention on the stock, alongside ongoing discussion of global energy demand and supply constraints. Together, these themes provide context for the recent share price strength and the debate about where value sits now.
- Exxon Mobil currently scores 4/6 on our valuation checks, which suggests some metrics point to the shares looking inexpensive while others are more balanced. We will look at what different valuation approaches say about that, then finish with a tool that can help you keep track of value over time.
Approach 1: Exxon Mobil Discounted Cash Flow (DCF) Analysis
A Discounted Cash Flow, or DCF, model projects a company’s future cash flows and then discounts those back to today’s dollars, giving an estimate of what the business could be worth per share right now.
For Exxon Mobil, the model uses last twelve month Free Cash Flow of about $28.1b as a starting point and then applies cash flow projections provided by analysts for several years, with further years extrapolated by Simply Wall St. For example, one projection for 2030 Free Cash Flow is $37.4b. This is then discounted back to today along with other years in the 2 Stage Free Cash Flow to Equity model.
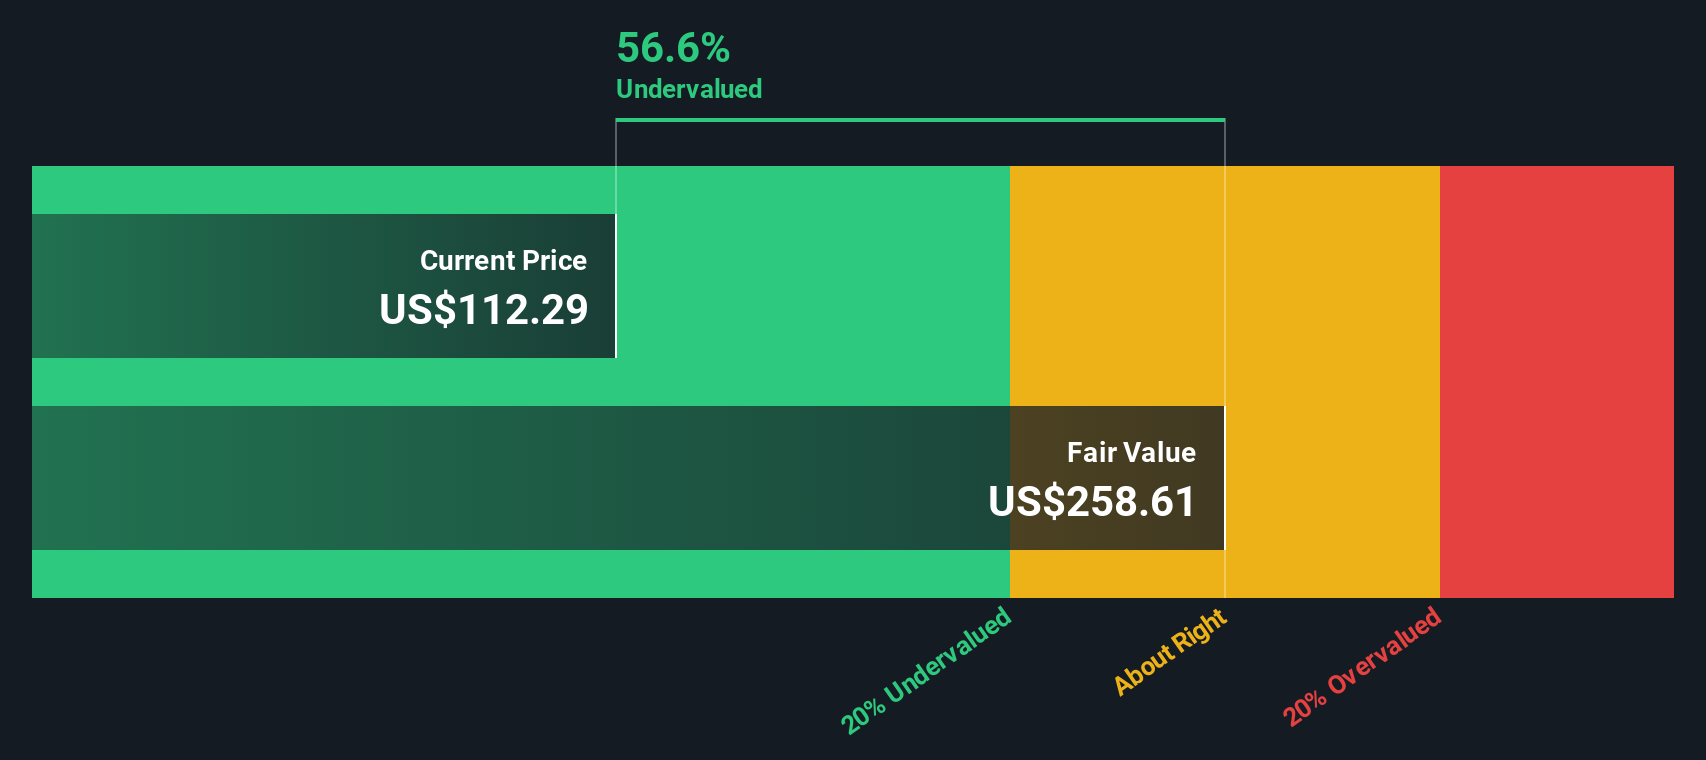
Adding all these discounted cash flows together gives an estimated intrinsic value of about $182.58 per share, compared with the recent share price of $133.64. On this basis, the DCF output implies the shares trade at a 26.8% discount, which points to the stock looking undervalued on this specific cash flow view.
Result: UNDERVALUED
Our Discounted Cash Flow (DCF) analysis suggests Exxon Mobil is undervalued by 26.8%. Track this in your watchlist or portfolio, or discover 882 more undervalued stocks based on cash flows.
Approach 2: Exxon Mobil Price vs Earnings
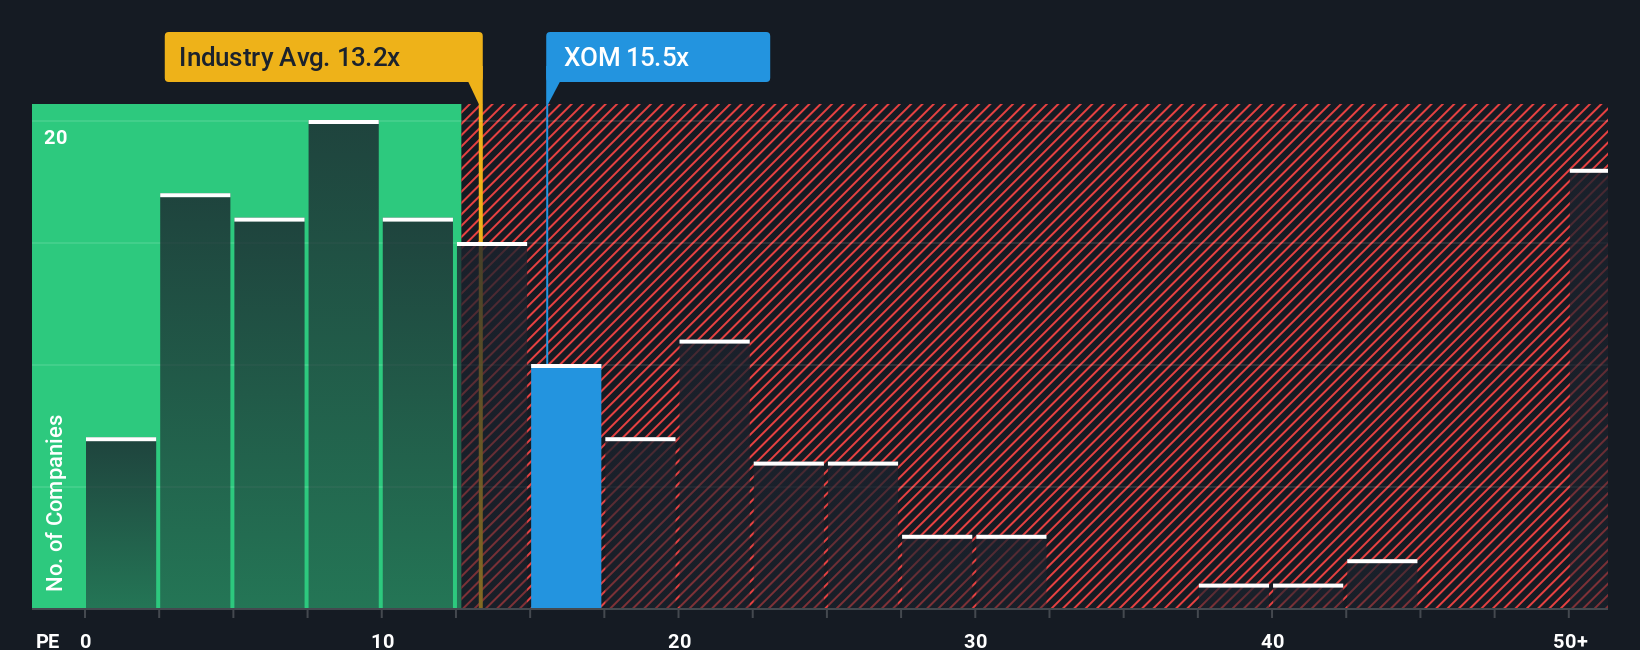
For a profitable company like Exxon Mobil, the P/E ratio is a straightforward way to see what investors are paying for each dollar of earnings. It links the share price directly to current earnings, which most investors already track closely.
What counts as a “normal” or “fair” P/E depends on factors like expected earnings growth and risk. Higher growth and perceived stability can justify a higher P/E, while lower growth or higher risk usually point to a lower figure. Exxon Mobil currently trades on a P/E of 18.82x. That sits above the Oil and Gas industry average of 13.51x, but below the peer group average of 25.46x, so the simple comparisons send a mixed signal.
Simply Wall St’s Fair Ratio metric aims to sharpen that picture. It estimates the P/E you might expect for Exxon Mobil at 24.14x, based on factors such as earnings growth characteristics, profit margins, industry, market cap and company specific risks. Because it blends these elements together, the Fair Ratio can be more informative than looking at raw industry or peer averages alone. With the current P/E of 18.82x sitting below the Fair Ratio of 24.14x, this approach points to the shares looking undervalued on an earnings multiple basis.
Result: UNDERVALUED
P/E ratios tell one story, but what if the real opportunity lies elsewhere? Discover 1430 companies where insiders are betting big on explosive growth.
Upgrade Your Decision Making: Choose your Exxon Mobil Narrative
Earlier we mentioned that there is an even better way to understand valuation, so let us introduce you to Narratives, a simple way to connect your view of Exxon Mobil’s story with the numbers behind it.
A Narrative is your own storyline for the company, where you spell out what you think is a reasonable fair value along with your expectations for future revenue, earnings and profit margins, instead of relying only on standard models or market multiples.
This story is then tied directly to a financial forecast and a resulting fair value estimate, so you can quickly compare that fair value to the current share price and decide whether the stock looks attractive, fully priced or expensive to you.
On Simply Wall St, Narratives sit inside the Community page, where millions of investors share their views, and each Narrative automatically updates when new information such as news or earnings is added to the platform.
For Exxon Mobil, one investor might create a Narrative that assumes very strong long term cash flows and a higher fair value, while another builds a more cautious Narrative with lower revenue and margin expectations that leads to a much lower fair value estimate.
Do you think there's more to the story for Exxon Mobil? Head over to our Community to see what others are saying!
This article by Simply Wall St is general in nature. We provide commentary based on historical data and analyst forecasts only using an unbiased methodology and our articles are not intended to be financial advice. It does not constitute a recommendation to buy or sell any stock, and does not take account of your objectives, or your financial situation. We aim to bring you long-term focused analysis driven by fundamental data. Note that our analysis may not factor in the latest price-sensitive company announcements or qualitative material. Simply Wall St has no position in any stocks mentioned.