Is Fannie Mae (OTCPK:FNMA) Pricing Make Sense After Recent Volatility In Mortgage Expectations
FEDERAL NATIONAL MORTGAGE ASSOC FNMA | 6.89 | -2.61% |
- If you have ever wondered whether Federal National Mortgage Association stock at around US$8.27 is offering value or just noise, you are not alone.
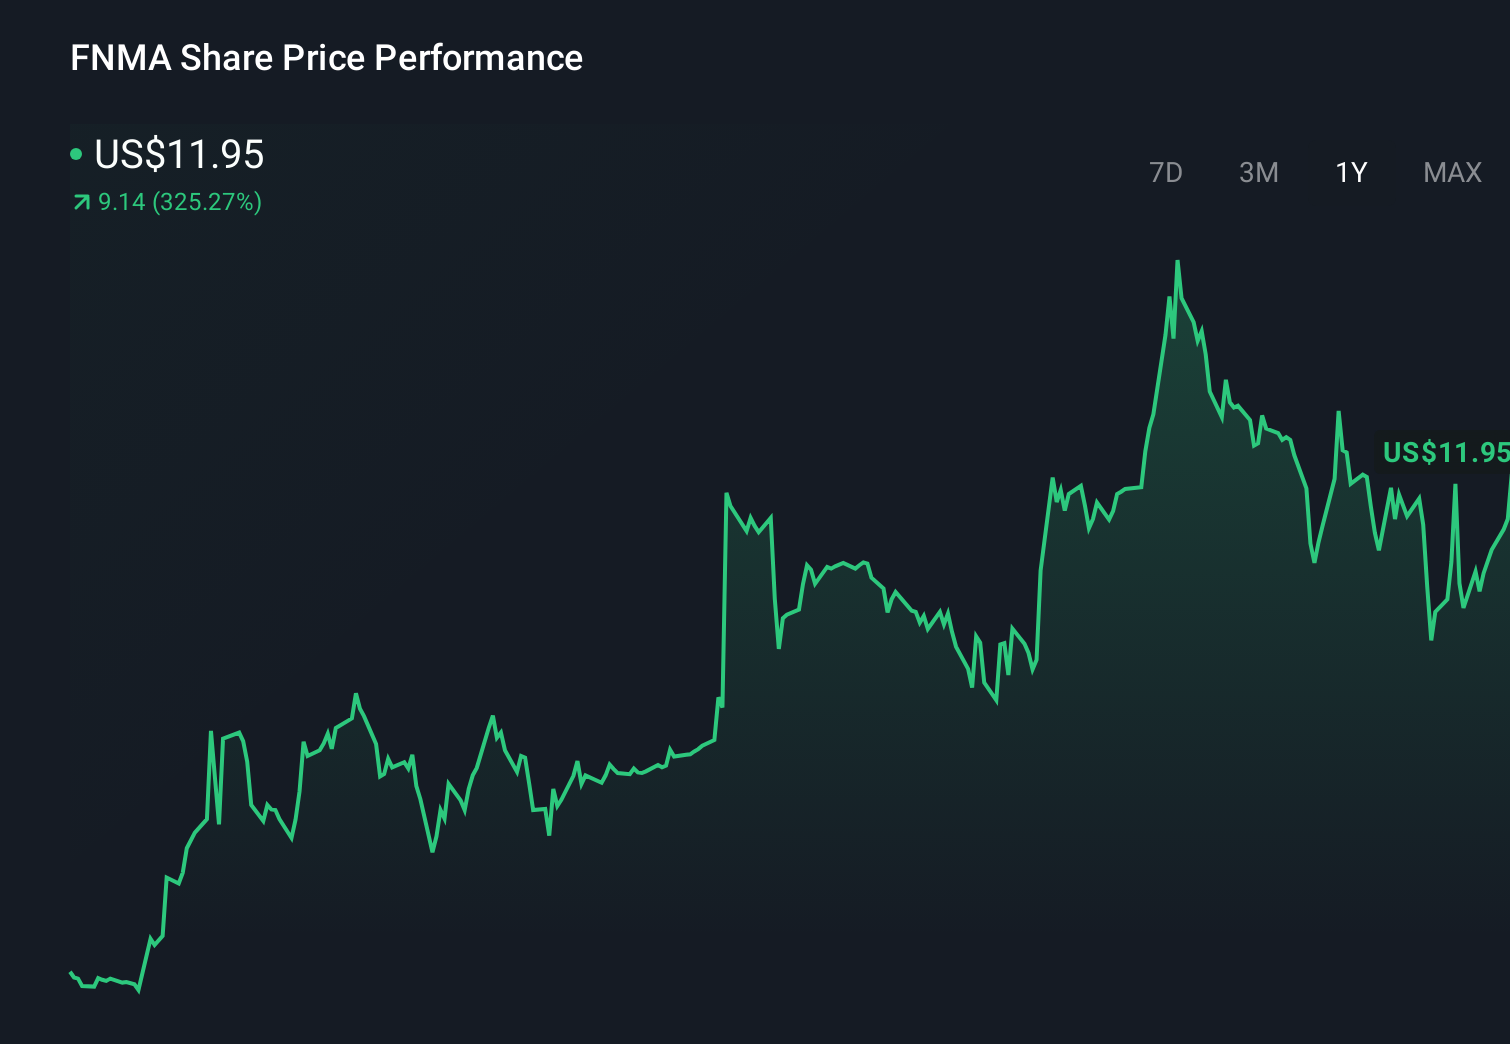
- The share price has seen a 1.1% move over the last 7 days, a 24.9% decline over 30 days, a 24.8% decline year to date, and a 21.3% gain over 1 year. The 3 year return has been very large and the 5 year return is more than 3x.
- Recent coverage has focused on Federal National Mortgage Association's role in the US mortgage market and how shifting expectations for housing activity and credit risk are feeding into sentiment on government sponsored enterprises. That context helps explain why the stock has seen both sharp pullbacks and strong multi year gains, as investors reassess how to price its exposure to the mortgage cycle.
- On Simply Wall St's 6 point valuation checklist, Federal National Mortgage Association scores 3 out of 6. We will unpack this by comparing different valuation approaches, then finish with a way to understand value that goes beyond just the headline numbers.
Approach 1: Federal National Mortgage Association Discounted Cash Flow (DCF) Analysis
A Discounted Cash Flow, or DCF, model estimates what a business might be worth today by projecting its future cash flows and then discounting those cash flows back to a present value.
For Federal National Mortgage Association, the model used is a 2 Stage Free Cash Flow to Equity approach. The latest twelve month free cash flow is reported at $5,614 million. Simply Wall St then projects cash flows out to 2035 in dollar terms, with estimates such as $2,771.8 million in 2026 and $987.4 million in 2035, and discounts each of those years back to today using its own assumptions. Projections beyond the usual analyst horizon are extrapolated rather than based on specific street estimates.
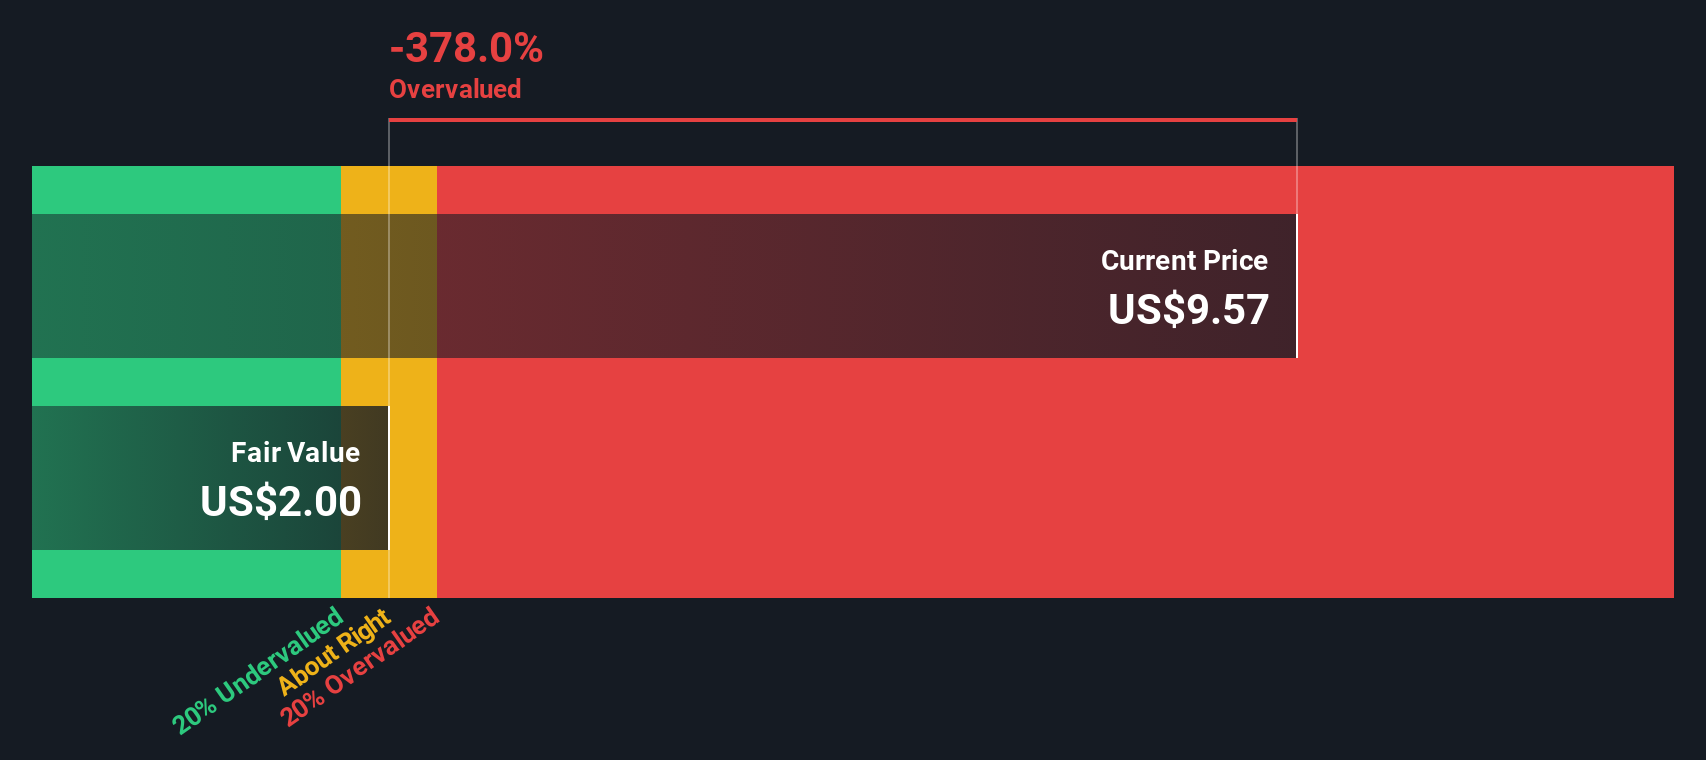
Pulling all of that together, the model arrives at an estimated intrinsic value of about $2.06 per share. Against a current share price of around $8.27, that implies the stock is very extended relative to this DCF estimate, with an intrinsic discount figure indicating it is 302.4% overvalued on this measure.
Result: OVERVALUED
Our Discounted Cash Flow (DCF) analysis suggests Federal National Mortgage Association may be overvalued by 302.4%. Discover 51 high quality undervalued stocks or create your own screener to find better value opportunities.
Approach 2: Federal National Mortgage Association Price vs Sales
For Federal National Mortgage Association, the preferred yardstick is the Price to Sales, or P/S, ratio, which can be useful when earnings are volatile or negative but the revenue base is meaningful. Investors often use P/S to get a cleaner sense of how the market is valuing each dollar of sales without the noise of short term profit swings.
What counts as a “normal” or “fair” P/S ratio usually depends on how quickly revenue is expected to grow and how risky those sales are. Higher expected growth and lower perceived risk can justify a higher multiple, while slower growth or higher risk tend to pull it down.
Federal National Mortgage Association currently trades on a P/S of 1.67x. That sits below the Diversified Financial industry average P/S of 2.44x and the peer group average of 3.96x. Simply Wall St’s Fair Ratio for the company is 5.57x, which is its proprietary estimate of what the P/S might be given factors such as the company’s earnings profile, industry, profit margins, market cap and key risks. This Fair Ratio can be more informative than simple peer or industry comparisons because it tries to align the multiple with the company’s specific fundamentals. On this measure, the current 1.67x P/S sits well below the 5.57x Fair Ratio.
Result: UNDERVALUED

P/S ratios tell one story, but what if the real opportunity lies elsewhere? Start investing in legacies, not executives. Discover our 23 top founder-led companies.
Upgrade Your Decision Making: Choose your Federal National Mortgage Association Narrative
Earlier we mentioned that there is an even better way to think about valuation, so let us introduce you to Narratives, which are simply your story about a company tied directly to your own assumptions for fair value, future revenue, earnings and margins. On Simply Wall St’s Community page, Narratives let you connect the dots from the story you believe about Federal National Mortgage Association, to a forecast, to a fair value, then compare that fair value with today’s price to help you decide whether you see it as an opportunity or something to avoid. The numbers update automatically when fresh news or earnings arrive, and there is room for very different opinions, such as one investor who expects a much higher future valuation for the stock while another pegs fair value far below the current price.
Do you think there's more to the story for Federal National Mortgage Association? Head over to our Community to see what others are saying!
This article by Simply Wall St is general in nature. We provide commentary based on historical data and analyst forecasts only using an unbiased methodology and our articles are not intended to be financial advice. It does not constitute a recommendation to buy or sell any stock, and does not take account of your objectives, or your financial situation. We aim to bring you long-term focused analysis driven by fundamental data. Note that our analysis may not factor in the latest price-sensitive company announcements or qualitative material. Simply Wall St has no position in any stocks mentioned.