Is Flowco Holdings (FLOC) Still Attractive After Its Recent Share Price Rally?
Flowco Holdings Inc Class A FLOC | 0.00 |
- If you are trying to figure out whether Flowco Holdings at a last close of US$25.18 looks attractively priced or not, the starting point is understanding how that price stacks up against the company’s fundamentals.
- The stock has returned 3.5% over the last 7 days, 22.1% over the last 30 days, 32.4% year to date and 20.2% over the last year, which raises questions about whether the recent share price reflects fair value or a changing view of risk.
- Recent coverage has focused on Flowco Holdings as an energy services stock, with attention on how the company is positioned within the sector and how its operations align with demand for energy infrastructure. This context helps explain why investors are reassessing what they are willing to pay for the stock at current levels.
- Flowco Holdings currently has a valuation score of 4 out of 6. The next sections will break down what that means using different valuation approaches and will also point you to a more complete way to think about value at the end of the article.
Approach 1: Flowco Holdings Discounted Cash Flow (DCF) Analysis
A Discounted Cash Flow model estimates what a stock could be worth by projecting the cash it may generate in the future and then discounting those cash flows back to today’s dollars.
For Flowco Holdings, the model uses a 2 Stage Free Cash Flow to Equity approach. The latest twelve month Free Cash Flow is about $129.9 million, and analysts plus extrapolations feed into ten year projections. For example, projected Free Cash Flow for 2026 is $125 million, rising in the model to $251.8 million by 2035, with earlier years such as 2027 to 2030 sitting between those levels based on a mix of analyst inputs and Simply Wall St estimates.
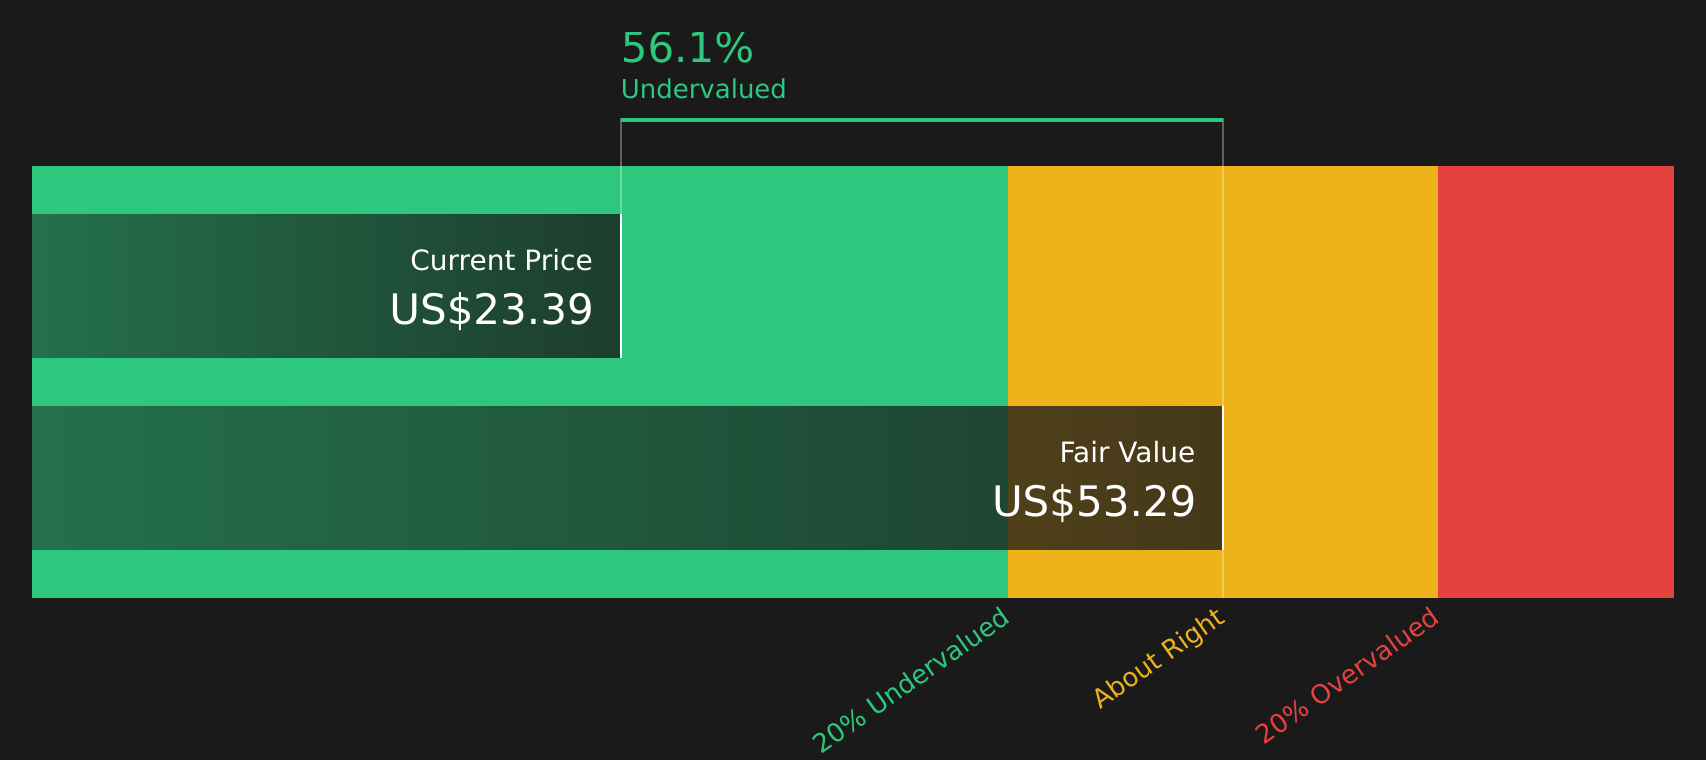
When all of these projected cash flows are discounted back and combined with a terminal value, the model arrives at an estimated intrinsic value of about $52.34 per share. Against a recent share price of $25.18, this implies the stock is 51.9% undervalued according to this DCF framework.
Result: UNDERVALUED
Our Discounted Cash Flow (DCF) analysis suggests Flowco Holdings is undervalued by 51.9%. Track this in your watchlist or portfolio, or discover 51 more high quality undervalued stocks.
Approach 2: Flowco Holdings Price vs Earnings
For a profitable company, the P/E ratio is a straightforward way to see how much you are paying for each dollar of earnings. In general, higher growth expectations and lower perceived risk can support a higher “normal” P/E, while slower growth or higher risk can point to a lower one.
Flowco Holdings currently trades on a P/E of 24.74x. That sits below the Energy Services industry average of about 26.60x and below the peer average of 37.81x, which suggests the stock is priced more cautiously than many peers on this simple earnings multiple view.
Simply Wall St’s Fair Ratio for Flowco Holdings is 24.67x. This is a proprietary estimate of what a reasonable P/E could be for the company, given factors such as its earnings growth profile, industry, profit margins, market cap and risk characteristics. Because it incorporates these company specific drivers instead of relying only on broad peer or industry comparisons, the Fair Ratio can give a more tailored view of value. With the current P/E of 24.74x sitting very close to the Fair Ratio of 24.67x, the stock looks priced at about the level this framework would suggest.
Result: ABOUT RIGHT

P/E ratios tell one story, but what if the real opportunity lies elsewhere? Start investing in legacies, not executives. Discover our 19 top founder-led companies.
Upgrade Your Decision Making: Choose your Flowco Holdings Narrative
Earlier it was mentioned that there is an even better way to understand valuation. Narratives take the story you believe about Flowco Holdings, including your own assumptions about future revenue, earnings and margins, and link that story to a forecast and then to a fair value that you can compare with the current price to help decide whether the stock looks attractive or not. All of this is available within an easy tool on Simply Wall St’s Community page that updates when new information such as earnings or news arrives. This means two investors can look at the same company and reach very different yet transparent conclusions. For example, one Narrative might lean closer to the higher analyst fair value around US$28.00, while a more cautious Narrative might sit near the lower end around US$24.00, giving you a clear view of how different expectations translate into different views of value.
Do you think there's more to the story for Flowco Holdings? Head over to our Community to see what others are saying!

This article by Simply Wall St is general in nature. We provide commentary based on historical data and analyst forecasts only using an unbiased methodology and our articles are not intended to be financial advice. It does not constitute a recommendation to buy or sell any stock, and does not take account of your objectives, or your financial situation. We aim to bring you long-term focused analysis driven by fundamental data. Note that our analysis may not factor in the latest price-sensitive company announcements or qualitative material. Simply Wall St has no position in any stocks mentioned.