Is Fluor (FLR) Offering Value After Recent 5% Pullback And Mixed Valuation Signals?
Fluor Corporation FLR | 49.27 49.10 | -0.59% -0.35% Post |
- If you are wondering whether Fluor's current share price gives you good value, this article walks through what the numbers say about the stock and how to interpret them.
- Fluor recently closed at US$45.48, with returns of 3.4% over the last 30 days, 9.1% year to date and 14.4% over the past year, while the last 7 days saw a 5.5% decline.
- Recent news around Fluor has focused on its role as a major engineering and construction group and how investors view its project pipeline and sector exposure. These themes help frame why the stock's shorter term pullback sits alongside stronger multi year returns of 24.3% over 3 years and 133.7% over 5 years.
- On our valuation checks, Fluor scores 3 out of 6, and you can see that breakdown in our valuation score. Next we will compare different valuation methods, then finish with a way to look beyond the headline metrics to judge value more effectively.
Approach 1: Fluor Discounted Cash Flow (DCF) Analysis
A Discounted Cash Flow, or DCF, model estimates what a company could be worth by projecting its future cash flows and then discounting those back to today’s value. In this case, the model used is a 2 Stage Free Cash Flow to Equity approach, which focuses on the cash potentially available to shareholders.
Fluor’s latest twelve month free cash flow is about US$189.5 million. Analysts provide free cash flow estimates through 2027, with US$371.4 million projected for that year, and further years are extrapolated by Simply Wall St to build out a 10 year path of cash flows. All of those future cash flows are discounted back to today using the DCF framework.
On this basis, the model arrives at an estimated intrinsic value of US$38.31 per share, compared with the recent share price of US$45.48. That implies the shares are about 18.7% above the DCF estimate, so the stock screens as overvalued on this particular measure.
Result: OVERVALUED
Our Discounted Cash Flow (DCF) analysis suggests Fluor may be overvalued by 18.7%. Discover 55 high quality undervalued stocks or create your own screener to find better value opportunities.

Approach 2: Fluor Price vs Earnings
For a profitable company, the P/E ratio is a useful way to think about what you are paying for each dollar of current earnings. It gives you a quick sense of how the market values those earnings compared with other companies.
What counts as a “normal” P/E depends a lot on how fast earnings are expected to grow and how risky those earnings are. Higher growth and lower perceived risk tend to support a higher P/E, while slower or less predictable earnings often line up with a lower P/E.
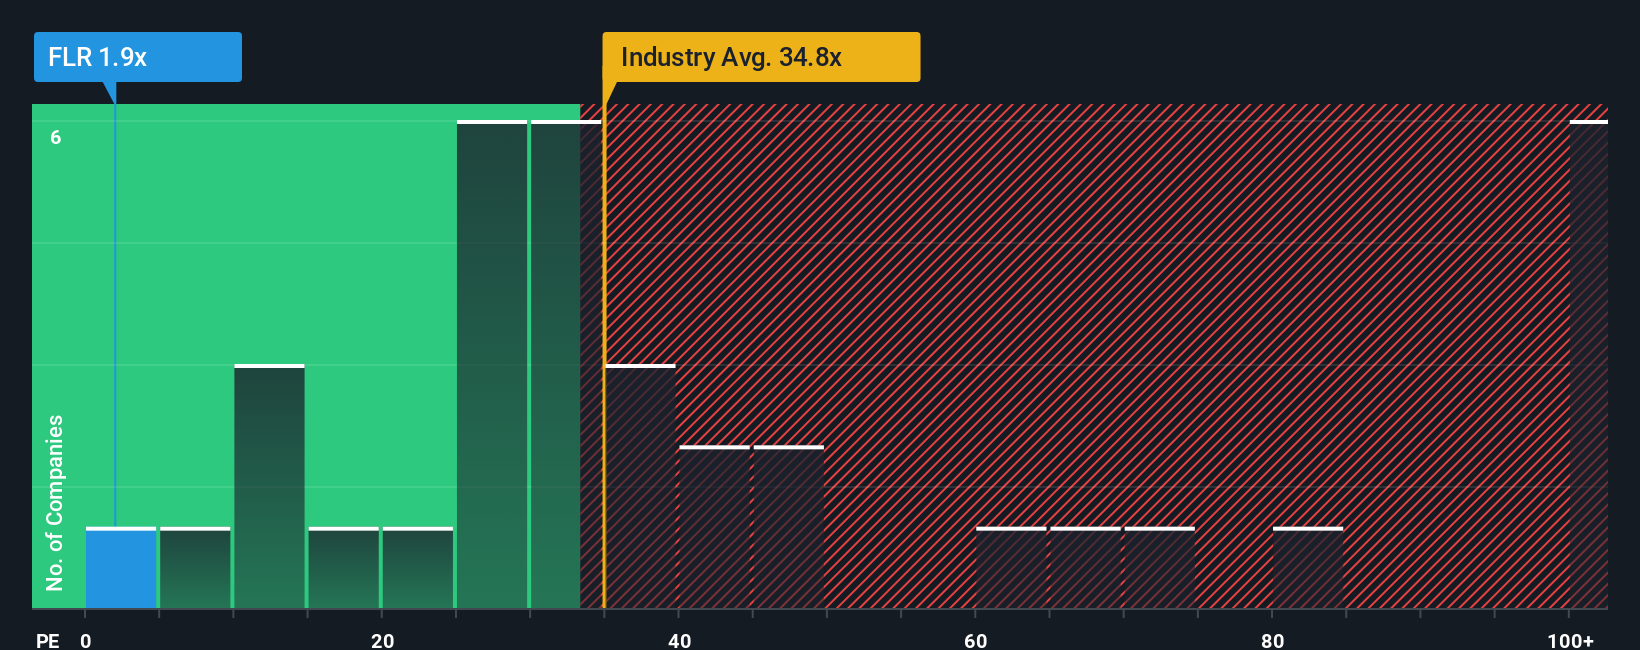
Fluor currently trades on a P/E of 2.17x. That sits well below the Construction industry average P/E of 35.04x and below the peer group average of 35.51x. On the surface, that makes the stock look cheap relative to its sector and peers.
Simply Wall St’s Fair Ratio for Fluor is 6.77x. This is a proprietary estimate of what the P/E “should” be, given factors such as earnings growth, profit margins, risk profile, industry and market cap. Because it blends these inputs, it can be more tailored than a simple comparison against industry or peer averages.
Comparing the Fair Ratio of 6.77x with the actual P/E of 2.17x suggests the shares trade below this modelled range.
Result: UNDERVALUED
P/E ratios tell one story, but what if the real opportunity lies elsewhere? Start investing in legacies, not executives. Discover our 23 top founder-led companies.
Upgrade Your Decision Making: Choose your Fluor Narrative
Earlier we mentioned that there is an even better way to understand valuation, so let us introduce you to Narratives, which simply means putting your view of Fluor’s story into numbers like future revenue, earnings, margins and a fair value, then comparing that to today’s price to guide possible buy or sell decisions.
On Simply Wall St’s Community page, Narratives are an easy tool that connects a company’s story to a forecast and then to a fair value. They update automatically when new earnings, news or guidance come through so your view stays aligned with fresh information.
For example, one Fluor Narrative on the optimistic end assumes a fair value of US$57.0 or even sees room up to a US$60.0 price target. A more cautious Narrative anchors around US$36.5, and seeing those different fair values side by side against the current share price helps you choose which story, and which assumptions, you think make the most sense.
For Fluor, here are previews of two leading Fluor Narratives:
Fair value: US$51.00 per share
Implied discount to this fair value: about 10.8% below the narrative fair value at the last close of US$45.48
Revenue growth assumption: 7.94% a year
- Analysts expect revenue to grow while profit margins settle at lower levels, with earnings and earnings per share shaped by cash generation, backlog and project mix.
- The view leans on Fluor’s backlog in areas like life sciences, infrastructure and Urban Solutions, plus opportunities in sectors such as semiconductors, data centers and low carbon projects.
- This narrative ties the analyst consensus price target to assumptions about 2028 revenue, earnings and a future P/E, using an 8.8% discount rate to bring those estimates back to today.
Fair value: US$36.50 per share
Implied premium to this fair value: about 24.6% above the narrative fair value at the last close of US$45.48
Revenue growth assumption: 6.59% a year
- Bearish analysts build in steady revenue growth but weaker profit margins, with 2028 earnings and earnings per share estimated on that basis.
- The fair value of US$36.50 lines up with the lower end of analyst targets, using a future P/E of about 16.5x on those 2028 earnings and a 7.9% discount rate.
- This view assumes the current share price of US$45.48 sits well above what those more cautious earnings and margin assumptions would support.
Do you think there's more to the story for Fluor? Head over to our Community to see what others are saying!

This article by Simply Wall St is general in nature. We provide commentary based on historical data and analyst forecasts only using an unbiased methodology and our articles are not intended to be financial advice. It does not constitute a recommendation to buy or sell any stock, and does not take account of your objectives, or your financial situation. We aim to bring you long-term focused analysis driven by fundamental data. Note that our analysis may not factor in the latest price-sensitive company announcements or qualitative material. Simply Wall St has no position in any stocks mentioned.