Is FMC (FMC) Finally At An Attractive Price After Multi Year Share Slump?
FMC Corporation FMC | 0.00 |
With FMC shares back at US$14.82, many investors are asking the same question: is the current price a rare value opportunity or a sign to stay cautious?
Over the last week the stock slipped 0.4%, extended to a 13.6% decline over the past month, while still showing a 3.3% gain year to date against a much steeper 59.1% loss over the past year and an 85.6% and 85.3% decline over the last 5 and 3 years respectively.
Recent market attention has focused on the scale of FMC's multi year share price weakness and what that implies for sentiment around its long term prospects. That context is important when thinking about whether the current valuation reflects company specific issues or a reset in expectations after a prolonged period of pressure on the share price.
Even after this long slide, FMC scores a 5 out of 6 valuation check for being assessed as undervalued. The next step is to look at how different valuation methods arrive at that score and then consider an even more complete way to think about value later in the article.
Approach 1: FMC Discounted Cash Flow (DCF) Analysis
A Discounted Cash Flow model estimates what a company could be worth by projecting its future cash flows and then discounting those back to today using a required rate of return.
For FMC, the model used is a 2 Stage Free Cash Flow to Equity approach. The latest twelve month free cash flow is a loss of $161.4 million, so the valuation leans heavily on expectations for a recovery in future free cash flow. Analyst and extrapolated projections supplied to the model show free cash flow turning positive and reaching $335.1 million in 2035, with interim projections such as $55.3 million in 2026 and $258 million in 2029, all in $ and then discounted back to today.
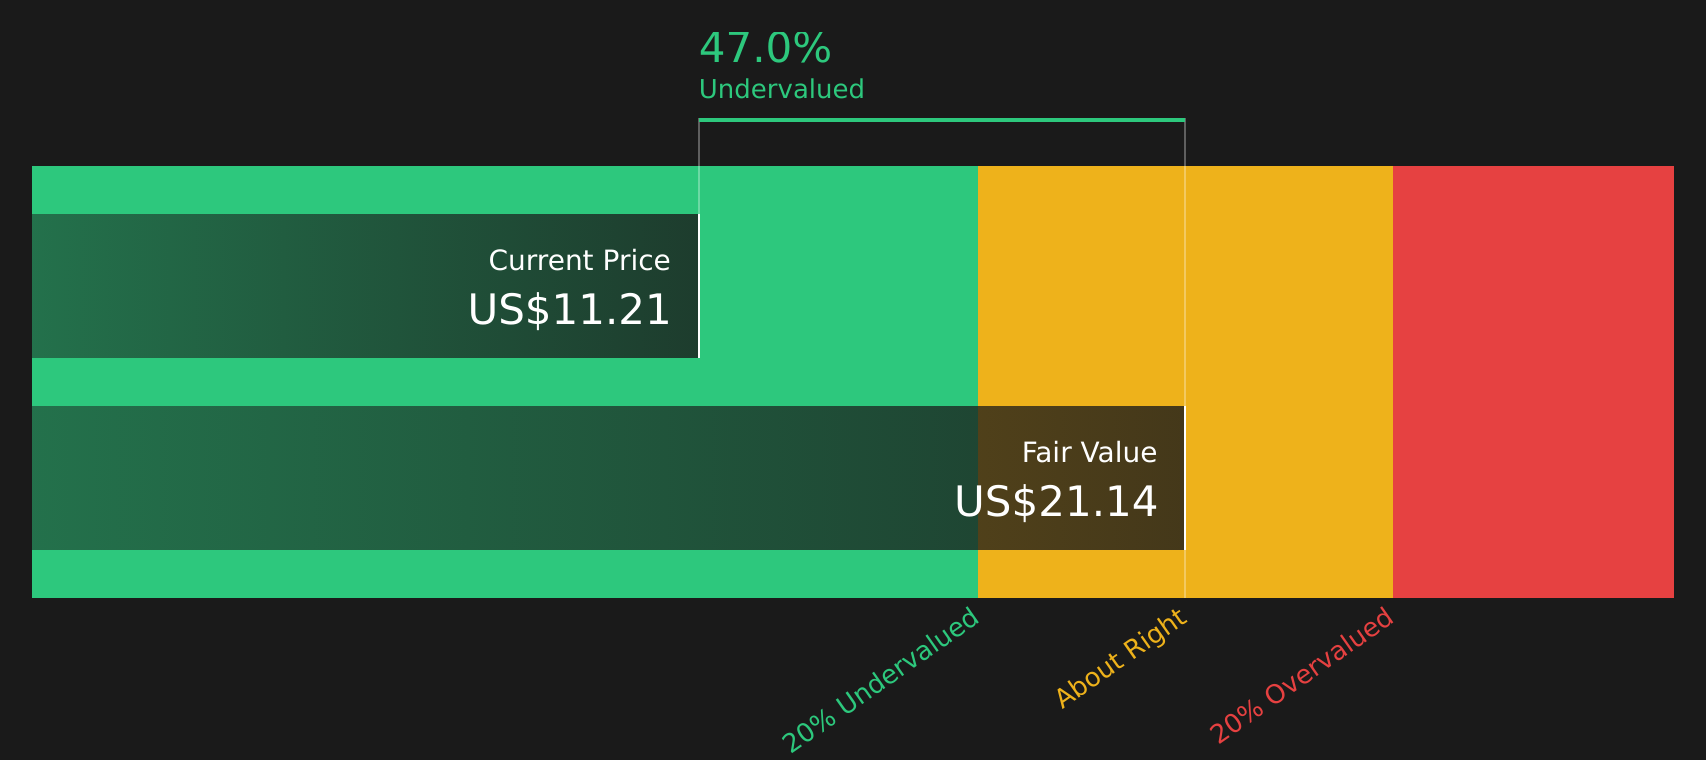
When these projected cash flows are added up and discounted, the estimated intrinsic value comes out at about $22.04 per share. Compared with the current share price of $14.82, this suggests the shares trade at a 32.7% discount, based on this DCF analysis.
Result: UNDERVALUED
Our Discounted Cash Flow (DCF) analysis suggests FMC is undervalued by 32.7%. Track this in your watchlist or portfolio, or discover 51 more high quality undervalued stocks.
Approach 2: FMC Price vs Sales
For companies where earnings are weak or volatile, valuing the business on sales can be more useful than P/E because revenue is less affected by short term swings in profitability. Investors usually expect higher P/S ratios when they see stronger growth potential and lower perceived risk, while slower growth or higher risk tends to justify a lower, more cautious multiple.
FMC currently trades on a P/S ratio of 0.53x. This sits below both the Chemicals industry average P/S of 1.16x and the peer average of 1.61x, which highlights how cautiously the market is pricing FMC’s revenue compared with many sector peers. Simply Wall St’s Fair Ratio for FMC is 1.73x, which reflects a proprietary view of what P/S might make sense after factoring in elements such as earnings growth, industry, profit margins, market cap and company specific risks.
This Fair Ratio approach gives a fuller picture than simply lining FMC up against broad industry or peer averages because it attempts to account for the traits that make FMC different. Comparing the current 0.53x P/S with the Fair Ratio of 1.73x suggests the shares trade at a discount on this metric.
Result: UNDERVALUED

P/S ratios tell one story, but what if the real opportunity lies elsewhere? Start investing in legacies, not executives. Discover our 18 top founder-led companies.
Upgrade Your Decision Making: Choose your FMC Narrative
Earlier the article mentioned that there is an even better way to understand valuation, so this is where Narratives come in as your bridge between the story you believe about FMC and the numbers you plug into a forecast.
A Narrative is simply your version of FMC’s story, linked to specific assumptions for future revenue, earnings and margins, which then roll up into an estimated fair value per share.
On Simply Wall St, Narratives are available on the Community page and are designed so you can easily connect a company story to a financial model without needing to build a spreadsheet or run complex formulas.
Once you choose or build a Narrative, you can compare its Fair Value to FMC’s current share price to help decide how it aligns with your own view of the company.
Narratives also update automatically when new information such as news or earnings is added to the platform, so your story and valuation do not stay frozen in old data.
For FMC, one investor might align with a more optimistic Narrative that uses a Fair Value around US$24.78, while another might lean toward a more cautious Narrative around US$13.00. This illustrates how different but reasonable assumptions about future growth and profitability can lead to very different views on what the stock may be worth today.
For FMC, here are previews of two leading FMC Narratives to make comparison easier:
Start by asking which story better matches how you see the business, then use that as the jumping off point to test your own assumptions on revenue, margins and valuation.
🐂 FMC Bull Case.Fair value in this Narrative: US$17.53 per share
Implied undervaluation vs US$14.82: about 15.5%
Assumed revenue growth: 5.33%
- Assumes demand for proprietary products and biologicals supports higher revenue and margin improvement over time.
- Builds in benefits from cost restructuring, lower manufacturing costs and a shift toward higher value portfolios.
- Accepts regulatory, pricing and balance sheet risks but treats them as manageable within the analyst consensus targets.
Fair value in this Narrative: US$13.00 per share
Implied overvaluation vs US$14.82: about 14.0%
Assumed revenue growth: 2.07%
- Focuses on pressure from regulatory bans, shifts toward organic farming and slower structural demand for conventional crop protection chemicals.
- Highlights dependence on aging specialty products, generic competition and questions around R&D intensity.
- Uses a lower revenue growth path and more modest margin recovery to arrive at a fair value close to the bearish analyst targets.
Both Narratives rely on specific numbers for revenue growth, margins, earnings, P/E and discount rates. The real task for you is to decide which set of assumptions feels closer to what you think is probable for FMC over the next few years, or whether your own blend sits somewhere in between.
If you want to go a step further and see how the community has built out these stories in detail, including full earnings and cash flow paths, valuations and risk flags, the easiest way is to start from the FMC Community page and work outward from there using your own judgment.
To see how these results tie into long-term growth, risks, and valuation, check out the full range of community narratives for FMC on Simply Wall St. Add the company to your watchlist or portfolio so you'll be alerted when the story evolves.
Do you think there's more to the story for FMC? Head over to our Community to see what others are saying!

This article by Simply Wall St is general in nature. We provide commentary based on historical data and analyst forecasts only using an unbiased methodology and our articles are not intended to be financial advice. It does not constitute a recommendation to buy or sell any stock, and does not take account of your objectives, or your financial situation. We aim to bring you long-term focused analysis driven by fundamental data. Note that our analysis may not factor in the latest price-sensitive company announcements or qualitative material. Simply Wall St has no position in any stocks mentioned.