Is FMC (FMC) Share Price Drop Creating A Potential Opportunity Now?
FMC Corporation FMC | 17.75 | +3.50% |
- If you are wondering whether FMC's current share price reflects its underlying value, you are not alone. This article is designed to walk you through what the numbers actually say.
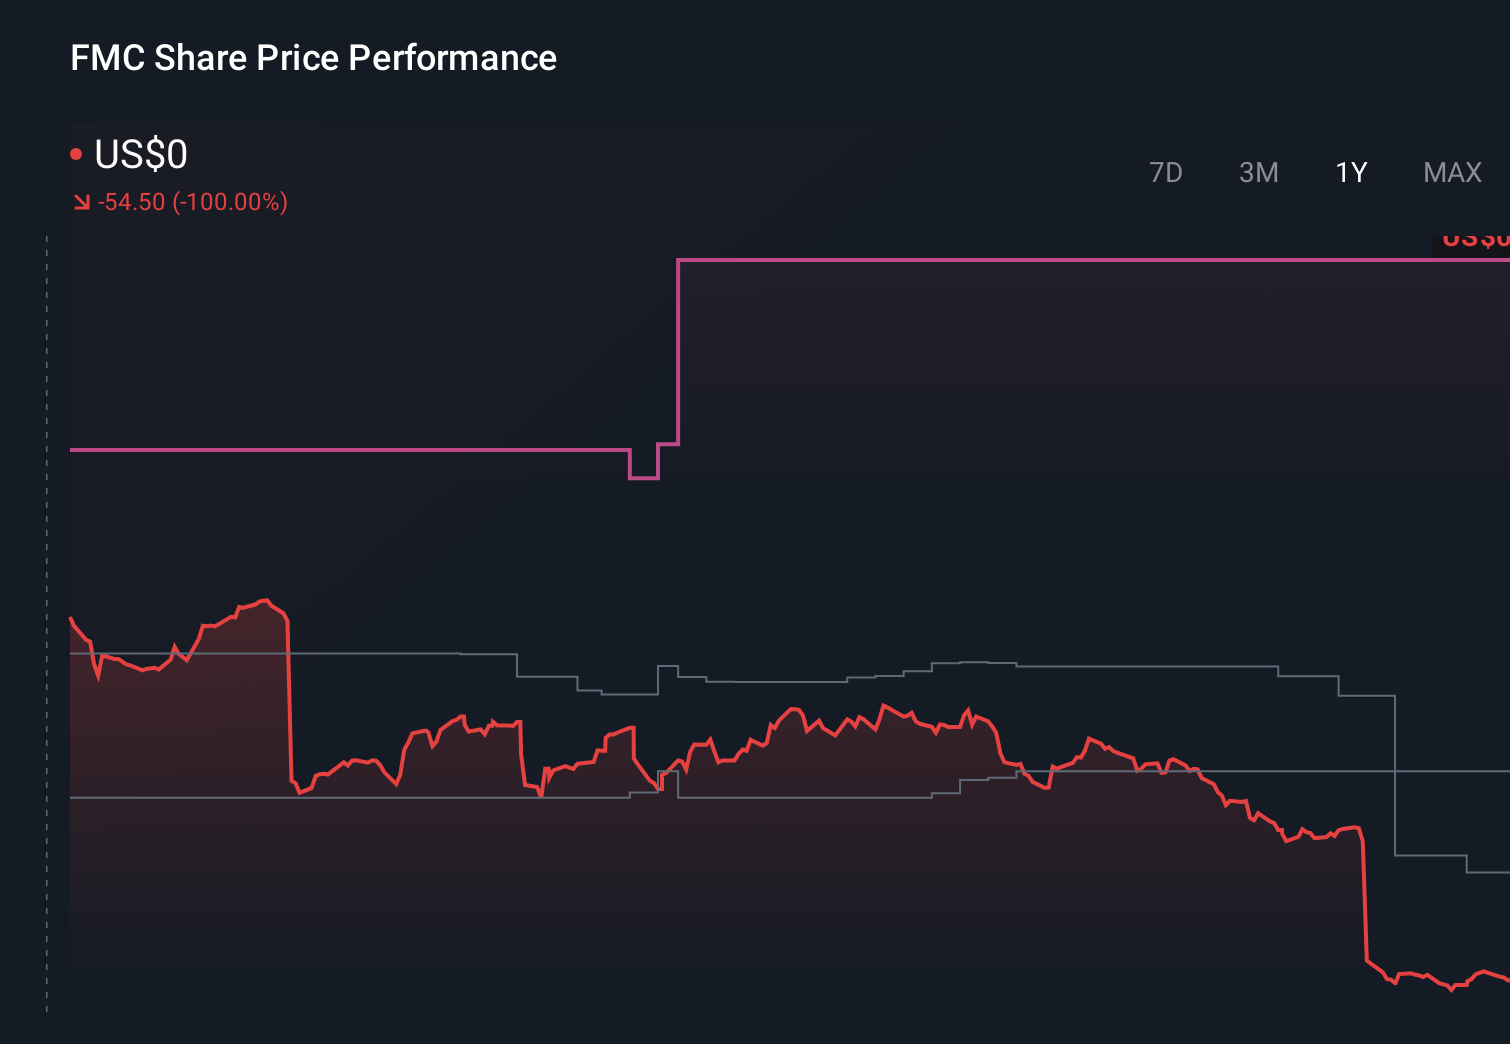
- FMC's share price closed at US$16.13, with returns of 5.1% over the last 7 days, 19.0% over the last 30 days, 12.5% year to date, but a 69.7% decline over 1 year, an 86.0% decline over 3 years and an 82.8% decline over 5 years.
- These price moves have come alongside ongoing attention on the agricultural chemicals space, as investors reassess how companies like FMC are positioned and priced. That mix of shorter term gains and longer term declines is prompting closer scrutiny of what the current valuation really implies.
- On our 6 point valuation framework, FMC currently scores 5 out of 6. Next, we will look at what different valuation methods suggest about the stock, before finishing with a way to think about valuation that can tie all these pieces together.
Approach 1: FMC Discounted Cash Flow (DCF) Analysis
A Discounted Cash Flow, or DCF, model estimates what a company could be worth today by projecting future cash flows and then discounting them back to a present value figure.
For FMC, the model used is a 2 Stage Free Cash Flow to Equity approach based on cash flow projections in $. The latest twelve month free cash flow is a loss of $400.66 million, so the starting point is currently negative. Analysts provide explicit free cash flow estimates out to 2029, with a projected free cash flow of $330 million in that year. Beyond the first few years, Simply Wall St extrapolates further free cash flow out to 2035, with discounted values ranging from about $254.39 million in 2026 to $126.15 million in 2035.
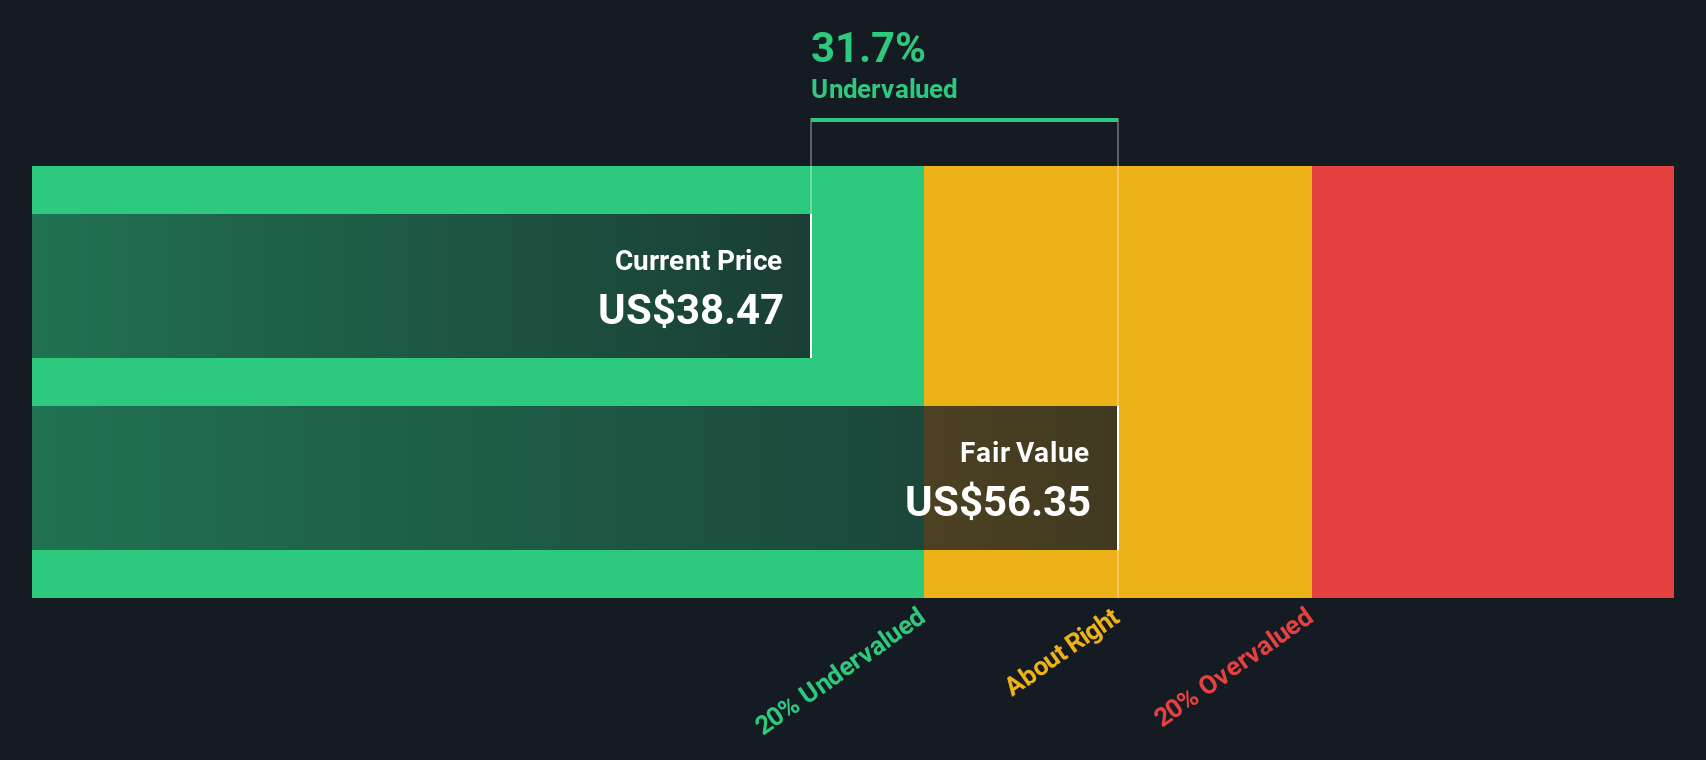
After discounting all those future cash flows back to today, the model arrives at an estimated intrinsic value of about $27.07 per share. Compared with the recent share price of US$16.13, this implies FMC is trading at roughly a 40.4% discount to this DCF estimate, which indicates the stock is undervalued according to this framework.
Result: UNDERVALUED
Our Discounted Cash Flow (DCF) analysis suggests FMC is undervalued by 40.4%. Track this in your watchlist or portfolio, or discover 887 more undervalued stocks based on cash flows.
Approach 2: FMC Price vs Sales
For a company like FMC, where investors are often looking at the scale of revenue rather than near term earnings, the P/S ratio is a useful anchor. It compares what the market is paying for each dollar of sales, which can be helpful for businesses in cyclical or recovering profit phases.
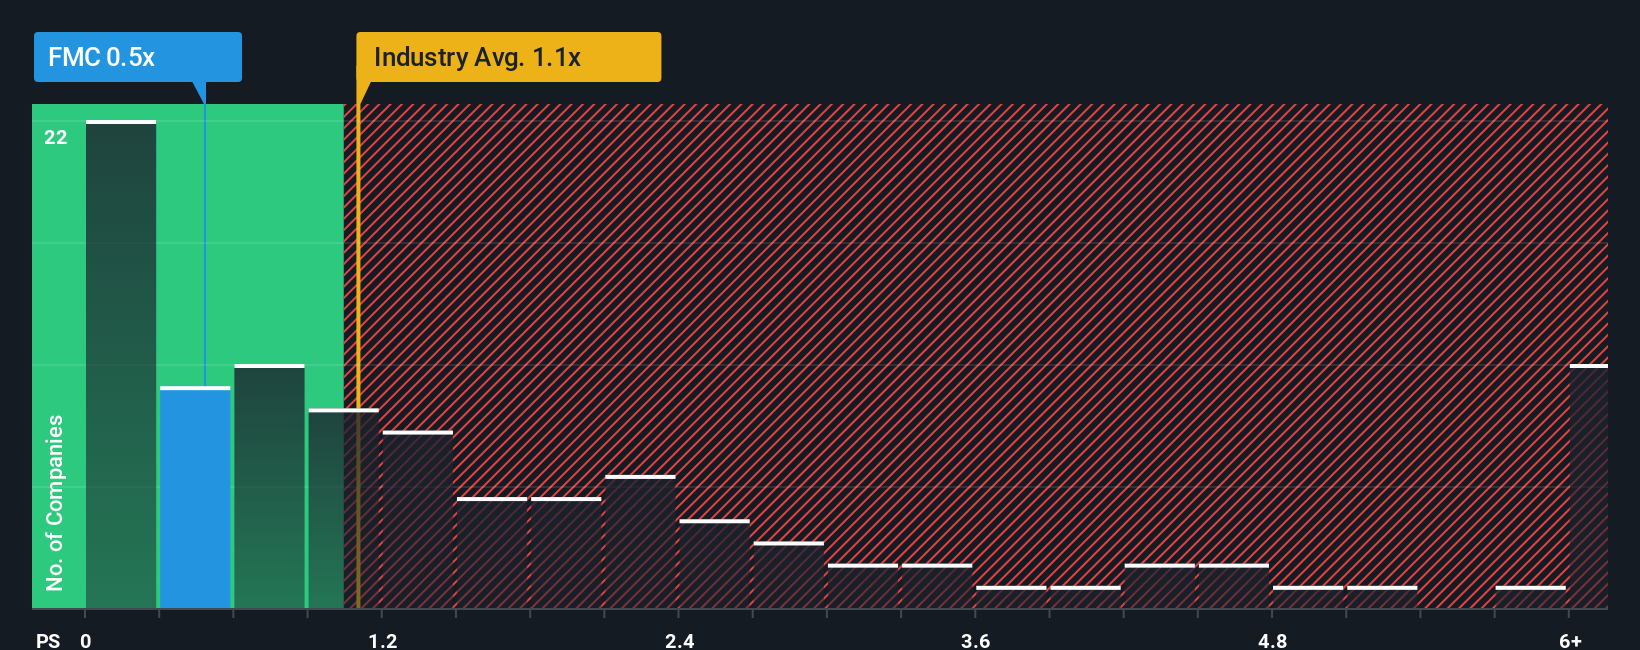
Higher growth expectations and lower perceived risk usually support a higher "normal" P/S multiple, while slower growth and higher risk tend to justify a lower one. FMC currently trades on a P/S of 0.56x. That sits below the Chemicals industry average of 1.19x and the peer average of 1.44x.
Simply Wall St also calculates a Fair Ratio for FMC of 1.54x. This is a proprietary estimate of what FMC's P/S might be, given factors such as its growth profile, profit margins, industry, market cap and company specific risks. Because it is tailored to FMC rather than based only on broad industry or peer group samples, the Fair Ratio can be a more targeted reference point. Compared with the current 0.56x P/S, the Fair Ratio suggests FMC trades at a discount on this metric.
Result: UNDERVALUED
P/S ratios tell one story, but what if the real opportunity lies elsewhere? Discover 1425 companies where insiders are betting big on explosive growth.
Upgrade Your Decision Making: Choose your FMC Narrative
Earlier we mentioned that there is an even better way to understand valuation, so let us introduce you to Narratives, a simple way to connect your view of FMC’s story with the numbers you see on the screen.
A Narrative is your own storyline for the company, where you set what you think are reasonable assumptions for future revenue, earnings and margins, then see how those inputs flow through to a fair value estimate.
On Simply Wall St, Narratives live in the Community page and are easy to use, so you can quickly build or choose a forecast for FMC, see the implied fair value and compare it with today’s price to help you decide whether the stock looks attractive or expensive on your terms.
Narratives are also kept fresh, because when new information like earnings or news arrives, the underlying data can change and your forecast and fair value respond automatically. For FMC, that could mean one investor’s Narrative points to a higher fair value based on stronger long term margins, while another sees a much lower fair value based on more cautious growth and profitability assumptions.
Do you think there's more to the story for FMC? Head over to our Community to see what others are saying!
This article by Simply Wall St is general in nature. We provide commentary based on historical data and analyst forecasts only using an unbiased methodology and our articles are not intended to be financial advice. It does not constitute a recommendation to buy or sell any stock, and does not take account of your objectives, or your financial situation. We aim to bring you long-term focused analysis driven by fundamental data. Note that our analysis may not factor in the latest price-sensitive company announcements or qualitative material. Simply Wall St has no position in any stocks mentioned.