Is Freeport-McMoRan (FCX) Still Attractive After Its Strong Share Price Momentum
Freeport-McMoRan, Inc. FCX | 61.38 | +0.29% |
- Wondering if Freeport McMoRan at around US$60.35 is offering fair value or a stretched price? You are not alone in asking whether the current share price still reflects a good long term entry.
- The stock has recently shown strong price momentum, with returns of 8.7% over the last 7 days, 27.0% over 30 days, 16.2% year to date, 52.9% over 1 year and 108.7% over 5 years.
- Recent coverage has put a spotlight on Freeport McMoRan as investors reassess copper related names and their sensitivity to long term demand trends. This context helps frame the recent price moves as part of a broader reassessment of how the market values mining companies with large copper exposure.
- On our checklist based valuation framework, Freeport McMoRan currently scores 2 out of 6 on undervaluation checks. Next we will walk through the main valuation methods behind that score and then finish by looking at a more holistic way to think about what the stock might be worth.
Freeport-McMoRan scores just 2/6 on our valuation checks. See what other red flags we found in the full valuation breakdown.
Approach 1: Freeport-McMoRan Discounted Cash Flow (DCF) Analysis
A Discounted Cash Flow model looks at the cash Freeport-McMoRan is expected to generate in the future, then discounts those projected cash flows back to today to estimate what the business might be worth now.
For Freeport-McMoRan, the model used is a 2 Stage Free Cash Flow to Equity approach, based on cash flow projections. The latest twelve month free cash flow is about $1.4b. Analyst and extrapolated estimates in this model suggest free cash flow could reach $9.4b by 2030, with intermediate years such as 2026 and 2027 projected at $3.8b and $7.2b respectively, all in $ and then discounted to reflect their value today.
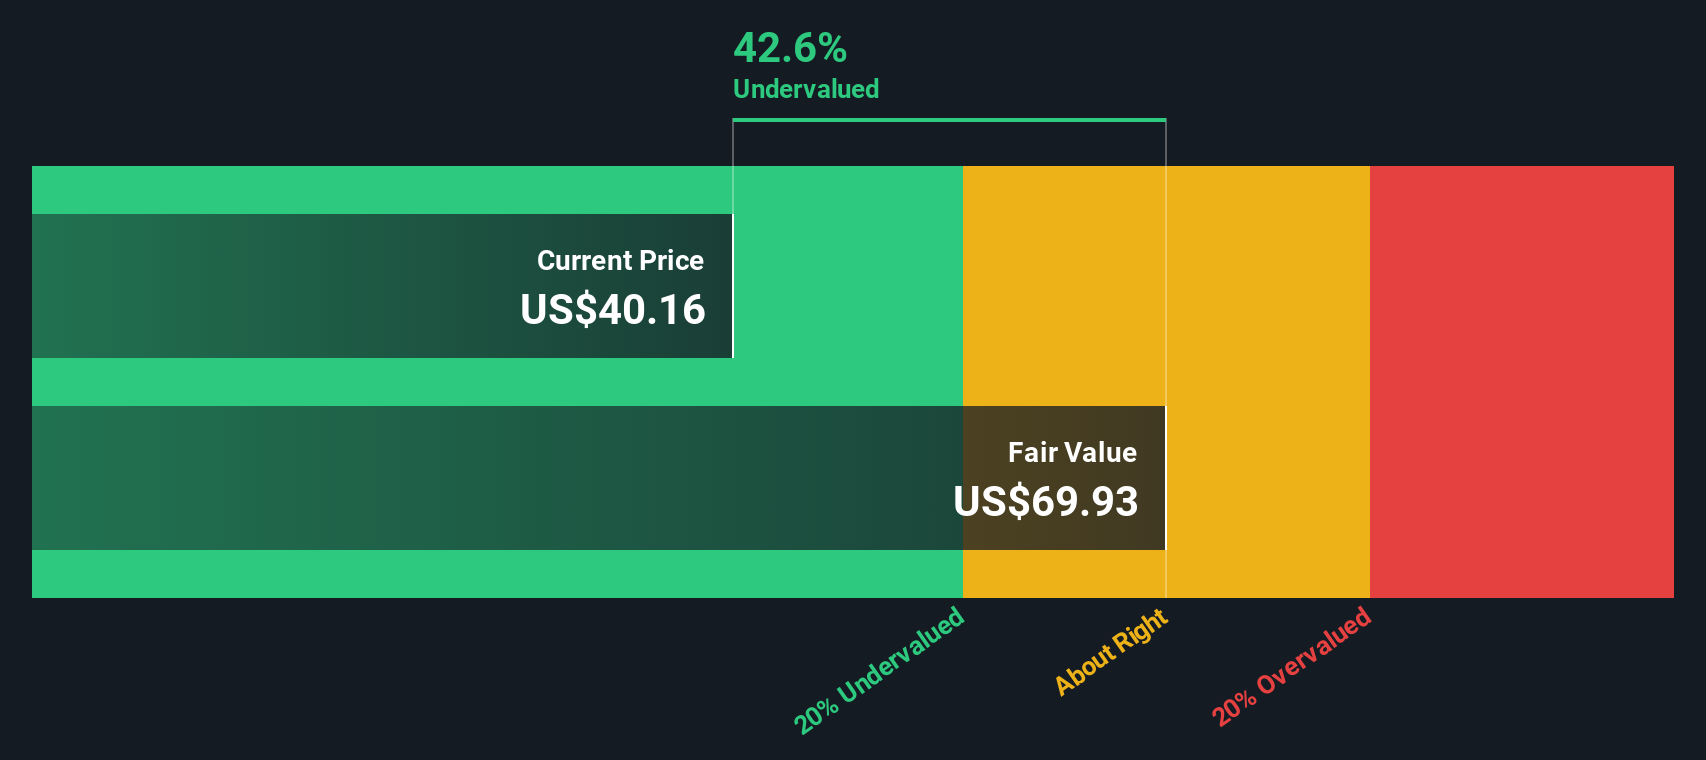
Adding these discounted cash flows together gives an estimated intrinsic value of about $110.36 per share. Compared with the current share price around $60.35, the DCF output for this model implies the stock is trading at roughly a 45.3% discount to this estimate.
Result: UNDERVALUED (on this model only)
Our Discounted Cash Flow (DCF) analysis suggests Freeport-McMoRan is undervalued by 45.3%. Track this in your watchlist or portfolio, or discover 884 more undervalued stocks based on cash flows.
Approach 2: Freeport-McMoRan Price vs Earnings
For a profitable company, the P/E ratio is a useful shorthand for how much investors are currently paying for each dollar of earnings. It links the share price directly to earnings power, which is usually a central driver of long term returns.
What counts as a normal or fair P/E depends on how quickly earnings are expected to grow and how risky those earnings are. Higher expected growth or lower perceived risk can justify a higher P/E, while lower growth or higher risk usually points to a lower multiple.
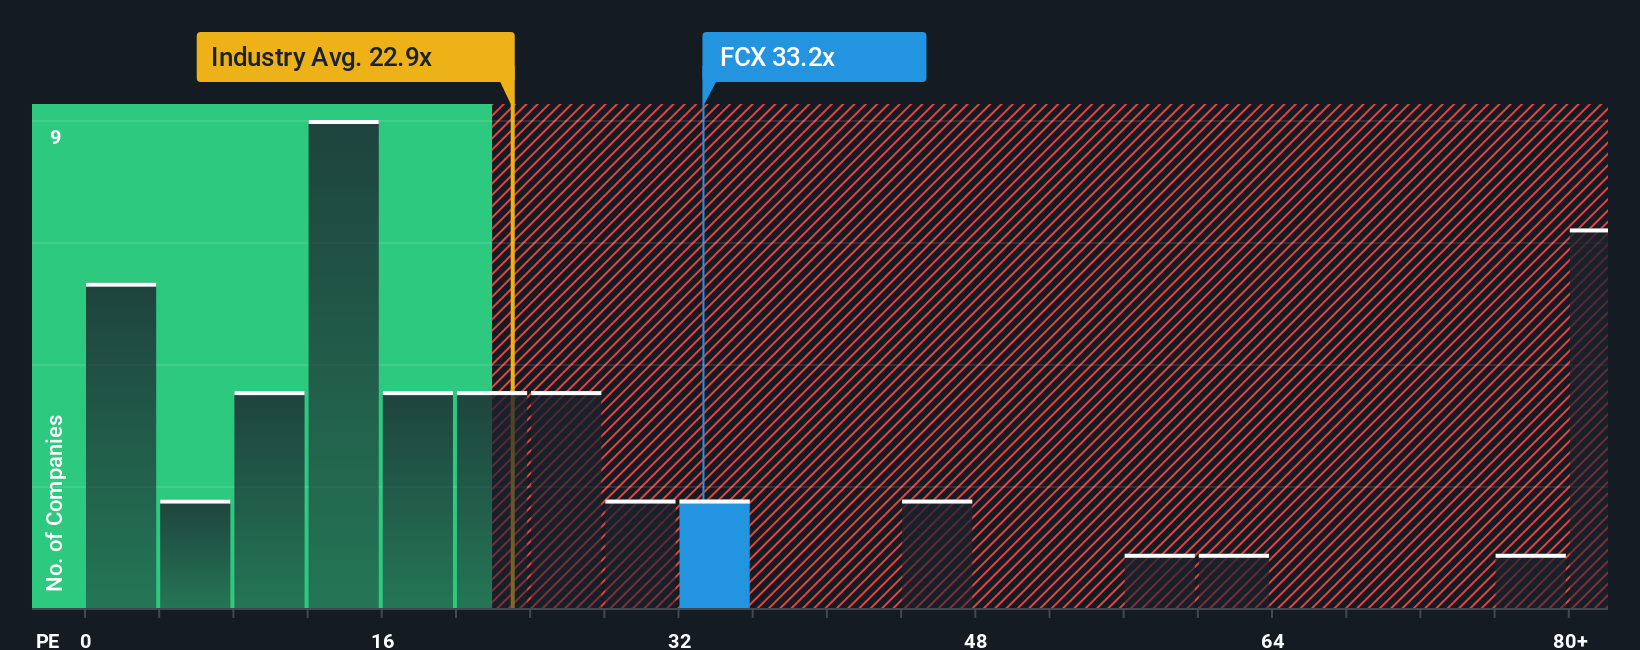
Freeport-McMoRan currently trades on a P/E of 41.97x. That sits above the Metals and Mining industry average of about 27.77x and the peer group average of about 31.00x, which on simple comparisons might look expensive.
Simply Wall St’s Fair Ratio for Freeport-McMoRan is 29.11x. This is a proprietary estimate of the P/E that could be appropriate given the company’s earnings profile, industry, profit margins, market cap and risk characteristics. Because it folds these factors into a single number, the Fair Ratio can be more tailored than a plain peer or industry comparison.
Set against the actual P/E of 41.97x, the Fair Ratio of 29.11x suggests the shares are trading above that tailored reference point.
Result: OVERVALUED
P/E ratios tell one story, but what if the real opportunity lies elsewhere? Discover 1440 companies where insiders are betting big on explosive growth.
Upgrade Your Decision Making: Choose your Freeport-McMoRan Narrative
Earlier we mentioned that there is an even better way to think about valuation. On Simply Wall St’s Community page you can use Narratives, where you write a simple story about Freeport-McMoRan, link that story to your assumptions for future revenue, earnings and margins, and the platform turns it into a financial forecast, a fair value, and an always updated comparison between that fair value and today’s price. This allows you to see for yourself whether your view suggests a buy, hold or sell. One investor, for example, might build a Narrative that supports a higher fair value of about US$57.00 based on stronger earnings potential. Another might use the same information set to argue for a much lower fair value closer to US$27.00 if they focus more on risks such as Grasberg, ore grades and policy changes. Both Narratives will automatically refresh as new news, earnings and estimates are added.
Do you think there's more to the story for Freeport-McMoRan? Head over to our Community to see what others are saying!

This article by Simply Wall St is general in nature. We provide commentary based on historical data and analyst forecasts only using an unbiased methodology and our articles are not intended to be financial advice. It does not constitute a recommendation to buy or sell any stock, and does not take account of your objectives, or your financial situation. We aim to bring you long-term focused analysis driven by fundamental data. Note that our analysis may not factor in the latest price-sensitive company announcements or qualitative material. Simply Wall St has no position in any stocks mentioned.