

Is Frontier Group Holdings (ULCC) Expensive After Earnings Lifted Revenue But Deepened Losses?
Frontier Group Holdings, Inc. ULCC | 0.00 |
Frontier Group Holdings (ULCC) is back in focus after its July 29 earnings release, which showed higher revenue for both the second quarter and first half of 2026 along with wider net and per share losses.
The earnings release on 29 July appears to have reset expectations for Frontier Group Holdings, with a 13.93% 1 day share price return and a 60.88% 90 day share price return helping to build momentum, even as the 5 year total shareholder return is still down 50.45%.
If the recent rebound has you thinking about what else is moving, it could be a good time to broaden your search and check out 19 top founder-led companies
Bulls highlight Frontier Group Holdings' revenue growth and recent share price rebound, while bears emphasize the widening losses and long-term declines for shareholders. Which side does the current valuation appear to support next?
Most Popular Narrative: 15.3% Overvalued
The most followed narrative pegs Frontier Group Holdings' fair value at $6.67, which sits below the recent $7.69 close, and puts the spotlight firmly on its long term earnings blueprint.
Analysts are assuming Frontier Group Holdings's revenue will grow by 17.2% annually over the next 3 years. Analysts assume that profit margins will increase from 9.6% today to 4.8% in 3 years time.
Investors may want to understand what could turn current losses into that future earnings profile. The narrative focuses on stronger revenue, rising margins and a tighter share count story.
Result: Fair Value of $6.67 (OVERVALUED)
However, Frontier Group Holdings still faces risks from possible persistent oversupply in US routes and higher non fuel costs, which could pressure margins and weaken this earnings narrative.
Another View: Frontier Group Holdings on a Cash Flow Basis
While the most popular Frontier Group Holdings narrative points to a fair value of $6.67 and labels the stock as 15.3% overvalued at $7.69, the SWS DCF model tells a very different story. It suggests a fair value of $28.82, which is far above the current share price and implies Frontier Group Holdings is trading at a steep discount. When two methods disagree this much, which one do you think better matches your expectations for future cash generation and risk?
For a closer look at how those projected cash flows translate into that $28.82 figure, and how sensitive the outcome is to the underlying assumptions, Look into how the SWS DCF model arrives at its fair value.
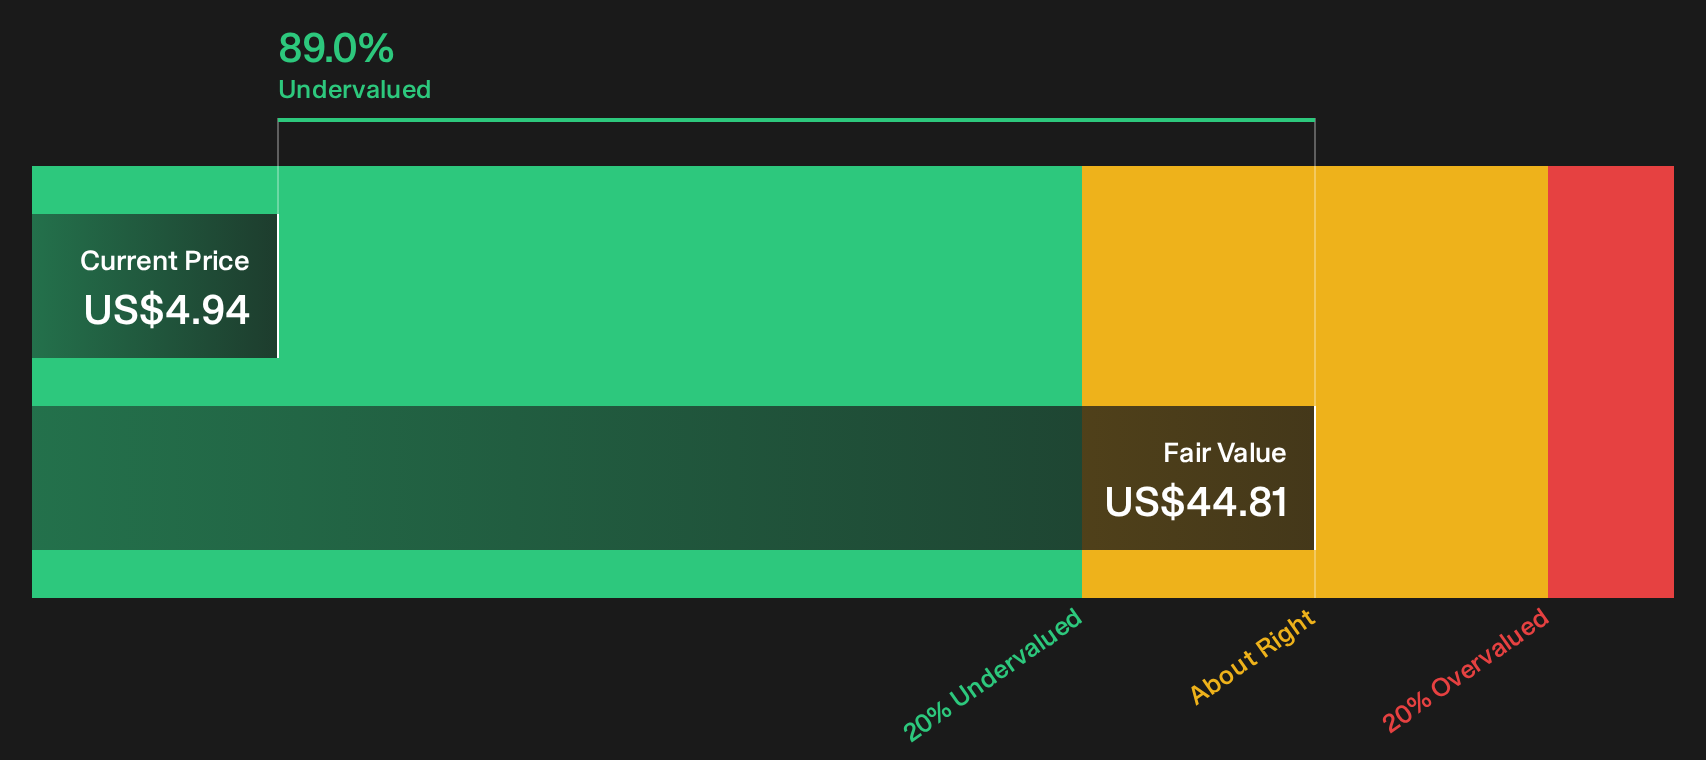
Simply Wall St performs a discounted cash flow (DCF) on every stock in the world every day (check out Frontier Group Holdings for example). We show the entire calculation in full. You can track the result in your watchlist or portfolio and be alerted when this changes, or use our stock screener to discover 53 high quality undervalued stocks. If you save a screener we even alert you when new companies match - so you never miss a potential opportunity.
Next Steps
After weighing both the rebound and the longer term pressure on Frontier Group Holdings, the next step is to check the data yourself and decide what matters most for your own portfolio. To see the balance of potential upside against the key concerns driving sentiment, take a closer look at the 1 key reward and 3 important warning signs.
Looking for more Frontier Group Holdings investment ideas?
If Frontier Group Holdings has sharpened your focus on opportunities, do not stop here. Put the same discipline to work by scanning other stocks with targeted filters.
- Target potential bargains by reviewing companies that screen as 53 high quality undervalued stocks based on their fundamentals and current market pricing.
- Prioritize strength and resilience by checking stocks in the solid balance sheet and fundamentals stocks screener (46 results) so you are not ignoring financial stability.
- Broaden your watchlist with under followed companies using the screener containing 18 high quality undiscovered gems before the crowd starts paying attention.
This article by Simply Wall St is general in nature. We provide commentary based on historical data and analyst forecasts only using an unbiased methodology and our articles are not intended to be financial advice. It does not constitute a recommendation to buy or sell any stock, and does not take account of your objectives, or your financial situation. We aim to bring you long-term focused analysis driven by fundamental data. Note that our analysis may not factor in the latest price-sensitive company announcements or qualitative material. Simply Wall St has no position in any stocks mentioned.