Is General Dynamics (GD) Still Attractive After Recent Double Digit Share Price Gain?
General Dynamics Corporation GD | 0.00 |
- If you are wondering whether General Dynamics at around US$345.84 still offers value, the key question is how its current price lines up with different ways of estimating fair worth.
- The share price has delivered a 29.0% return over the last year and 73.5% over three years. The recent 10.4% gain over 7 days contrasts with a 1.3% decline over the last month and a modest 0.7% return year to date.
- Recent attention on the defense sector, including ongoing geopolitical tensions and continued focus on government defense budgets, has kept General Dynamics on many investors' radar. These themes help frame how the market is currently thinking about risk and opportunity in the stock.
- General Dynamics currently has a valuation score of 4/6. This reflects how it screens on several common valuation checks. Next, you will see how different methods assess its price today, along with a broader way of thinking about valuation at the end of the article.
Approach 1: General Dynamics Discounted Cash Flow (DCF) Analysis
A Discounted Cash Flow model takes estimates of future cash the business may generate and discounts those flows back to today to arrive at an estimated value per share.
For General Dynamics, the model starts with last twelve month free cash flow of about $6.3b. Analysts and internal estimates feed into a 2 Stage Free Cash Flow to Equity model, which includes specific forecasts through 2030 and then extrapolated figures beyond that. For example, projected free cash flow for 2030 is $5.4b, with interim annual projections between 2026 and 2035 ranging from roughly $4.5b to $6.5b, based on various analyst sources and growth estimates.
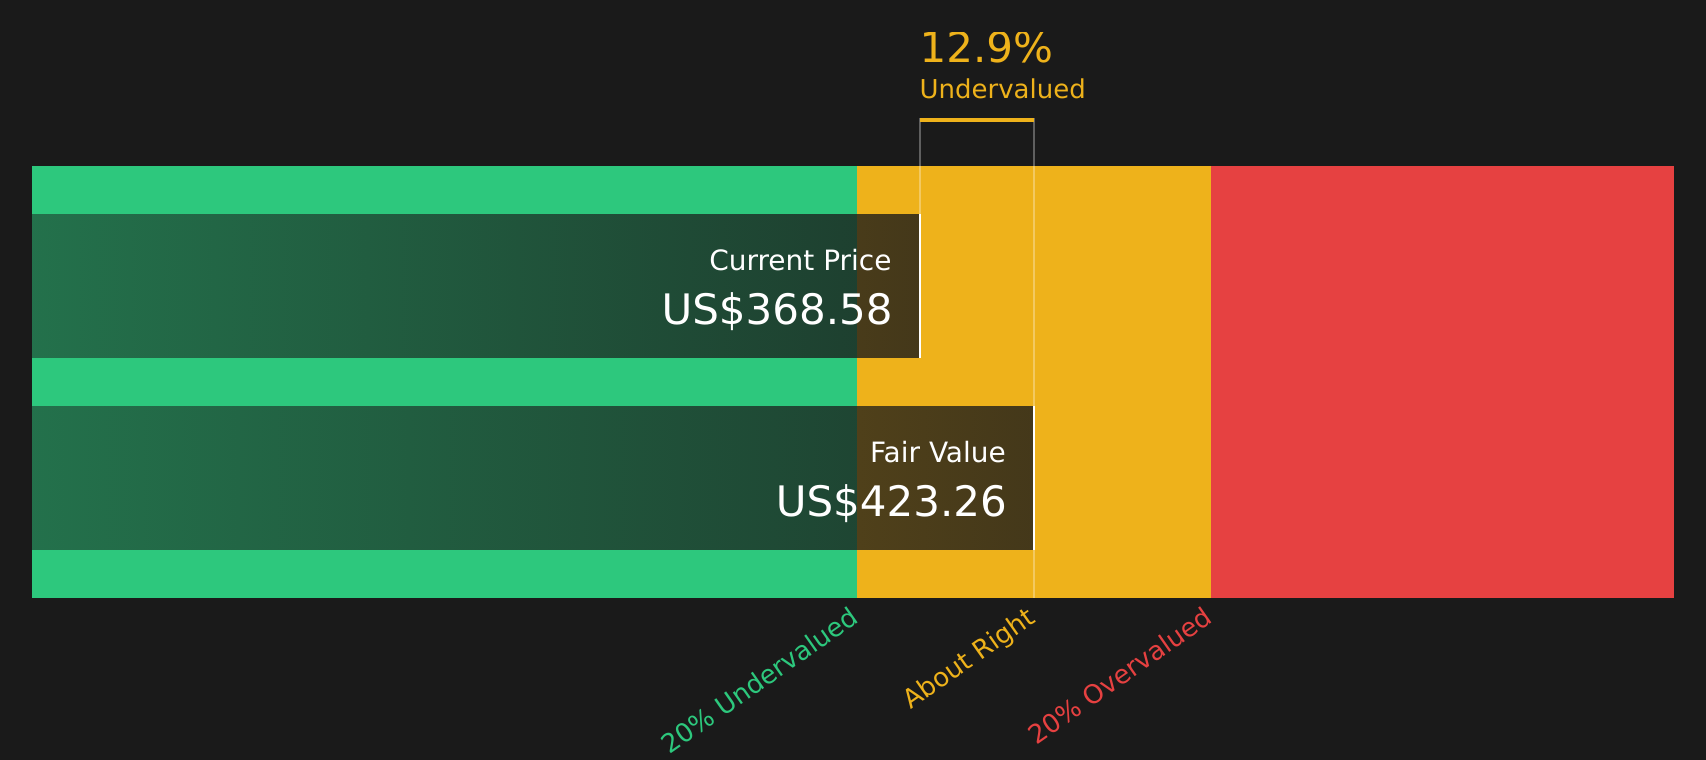
When all these projected cash flows are discounted back to today, the DCF model arrives at an estimated intrinsic value of about $403.82 per share. Compared with a recent share price around $345.84, this suggests the stock trades at roughly a 14.4% discount to that DCF estimate. This may indicate a potentially undervalued entry point for investors who are comfortable with the cash flow assumptions behind the model.
Result: UNDERVALUED
Our Discounted Cash Flow (DCF) analysis suggests General Dynamics is undervalued by 14.4%. Track this in your watchlist or portfolio, or discover 51 more high quality undervalued stocks.
Approach 2: General Dynamics Price vs Earnings
For a profitable company like General Dynamics, the P/E ratio is a useful shorthand for how much you are paying for each dollar of current earnings. It helps you compare the share price with what the business is actually generating today, which many investors find more concrete than revenue or asset based multiples.
What counts as a “normal” P/E depends on how fast earnings are expected to grow and how risky those earnings appear. Higher growth or lower perceived risk can justify a higher P/E, while slower growth or higher risk usually lines up with a lower one.
General Dynamics currently trades on a P/E of about 21.51x. That sits well below the Aerospace & Defense industry average of about 37.02x and the peer average of around 37.80x. Simply Wall St also calculates a “Fair Ratio” of about 29.74x, which reflects what P/E might be reasonable given factors such as earnings growth, profit margins, industry, market cap and company specific risks.
Because the Fair Ratio incorporates these fundamentals, it can be more tailored than a simple comparison with industry or peer averages. With the current P/E at 21.51x versus a Fair Ratio of 29.74x, General Dynamics screens as trading below that fair range on this metric.
Result: UNDERVALUED

P/E ratios tell one story, but what if the real opportunity lies elsewhere? Start investing in legacies, not executives. Discover our 18 top founder-led companies.
Upgrade Your Decision Making: Choose your General Dynamics Narrative
Earlier it was mentioned that there is an even better way to understand valuation. Narratives on Simply Wall St’s Community page let you turn your view of General Dynamics into a clear story that links what you think is happening with its backlog, defense demand and technology exposure to a financial forecast and a fair value. The Narrative then compares that fair value with the current price to help you judge whether the stock looks attractive or stretched. It also automatically refreshes your view when new information such as earnings, contract news or analyst targets arrives.
For example, one investor might build a Narrative closer to the most bullish analyst fair value of about US$444 if they focus on record backlog and margin potential. Another might anchor nearer the most cautious view around US$327 if they are more focused on execution, debt and contract risks. You can see both side by side to decide which story you find more convincing.
Do you think there's more to the story for General Dynamics? Head over to our Community to see what others are saying!

This article by Simply Wall St is general in nature. We provide commentary based on historical data and analyst forecasts only using an unbiased methodology and our articles are not intended to be financial advice. It does not constitute a recommendation to buy or sell any stock, and does not take account of your objectives, or your financial situation. We aim to bring you long-term focused analysis driven by fundamental data. Note that our analysis may not factor in the latest price-sensitive company announcements or qualitative material. Simply Wall St has no position in any stocks mentioned.