Is General Motors (GM) Still Attractive After A 77% One Year Share Price Surge?
General Motors Company GM | 0.00 |
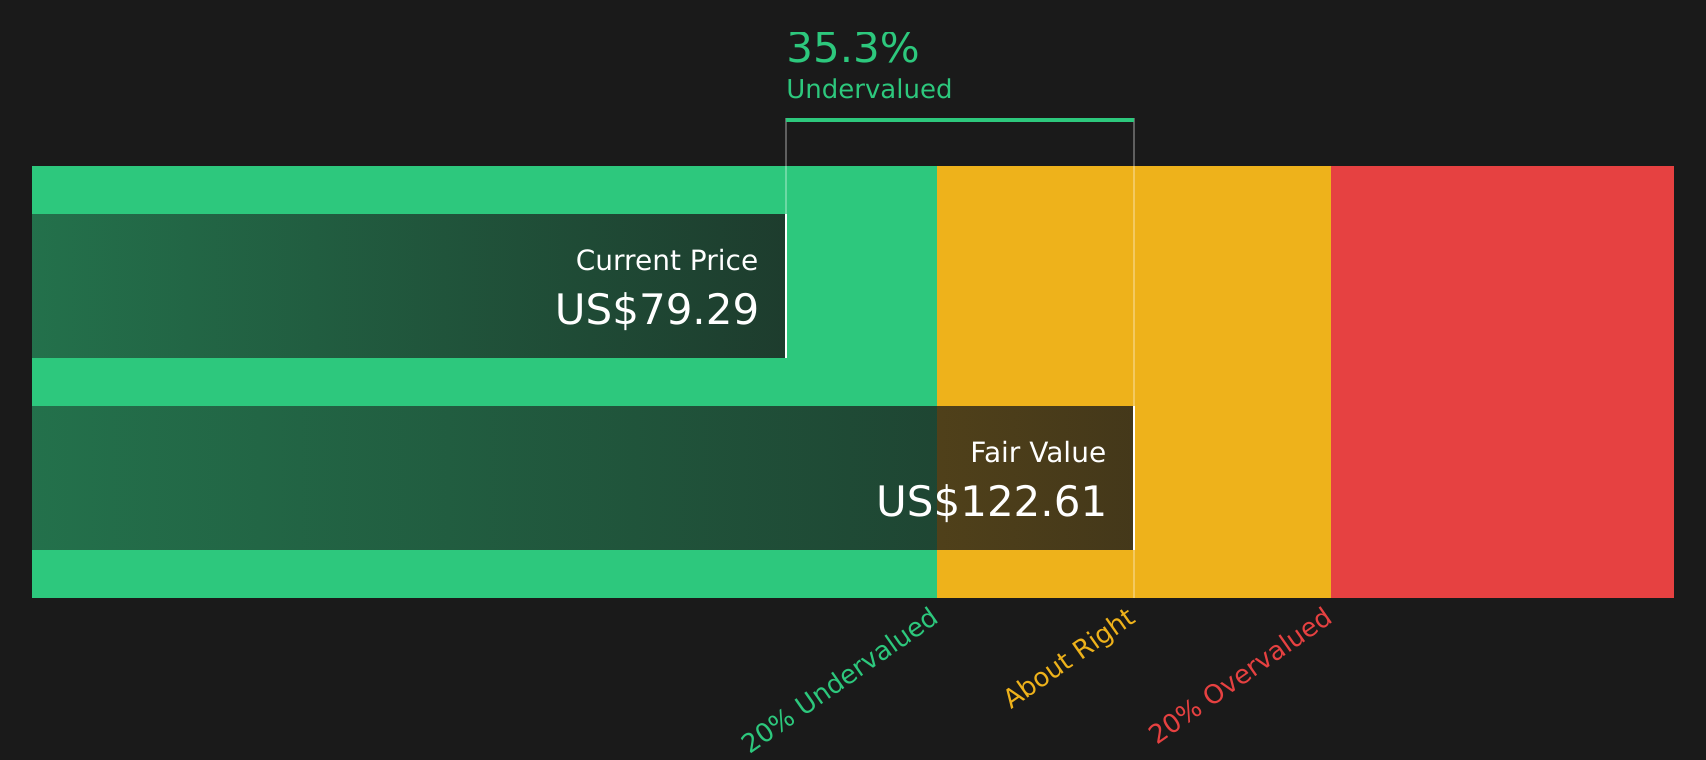
- Wondering if General Motors at around US$79.05 is still a sensible entry point or more of a hold? This article focuses squarely on what you are getting for the price you pay.
- The stock has seen mixed recent returns, with a 0.5% decline over the last week, an 8.6% gain over the last 30 days, a 2.4% decline year to date, and a 76.8% return over the past year, plus a 147.8% return over 3 years and 39.3% over 5 years.
- Recent coverage around General Motors has centered on ongoing execution in core auto manufacturing, its positioning in the US market, and broader discussions about how legacy automakers are approaching electrification and software. These themes help frame how investors are thinking about both the opportunities and the risks reflected in the share price.
- On Simply Wall St's valuation checks, General Motors currently has a valuation score of 4 out of 6. This sets up a closer look at how different valuation approaches line up today and hints at an even richer way to think about valuation that will come at the end of this article.
Approach 1: General Motors Discounted Cash Flow (DCF) Analysis
A Discounted Cash Flow, or DCF, model estimates what a business might be worth today by projecting its future cash flows and then discounting those back to a present value.
For General Motors, the latest twelve month Free Cash Flow sits at about $16.29b. Analysts provide explicit forecasts out to 2027, where Free Cash Flow is estimated at $10.73b. Beyond that, Simply Wall St extends the projections using its own assumptions, reaching an estimated Free Cash Flow of $12.59b in 2035. Each year is discounted back to today using a 2 Stage Free Cash Flow to Equity approach.
Pulling these projections together, the model arrives at an intrinsic value of roughly $119.28 per share. Compared with the current share price around $79.05, the DCF output implies the stock trades at a 33.7% discount. On this model General Motors appears undervalued.
Result: UNDERVALUED
Our Discounted Cash Flow (DCF) analysis suggests General Motors is undervalued by 33.7%. Track this in your watchlist or portfolio, or discover 58 more high quality undervalued stocks.
Approach 2: General Motors Price vs Earnings
For a profitable company, the P/E ratio is a useful shorthand for how much you are paying for each dollar of earnings. It links directly to what many investors watch most closely, current profits, and is easy to compare with other stocks in the same space.
What counts as a “normal” P/E depends on how fast earnings are expected to grow and how risky those earnings appear. Higher growth and lower perceived risk can support a higher P/E, while lower growth or higher uncertainty usually point to a lower one.
General Motors currently trades on a P/E of 22.41x. That sits above the Auto industry average of 19.34x, but below the peer group average of 41.61x. Simply Wall St also calculates a “Fair Ratio”, which is the P/E level its model suggests based on factors such as earnings growth, profit margins, industry, market value and risk. For General Motors, this Fair Ratio is 26.16x.
This company specific Fair Ratio can be more informative than a simple peer or industry comparison because it adjusts for the mix of growth, risk and profitability that is unique to General Motors. With the current 22.41x P/E sitting below the 26.16x Fair Ratio, the shares screen as undervalued on this metric.
Result: UNDERVALUED

P/E ratios tell one story, but what if the real opportunity lies elsewhere? Start investing in legacies, not executives. Discover our 19 top founder-led companies.
Upgrade Your Decision Making: Choose your General Motors Narrative
Earlier the article mentioned that there is an even better way to think about valuation, and Narratives are that tool. They let you attach a clear story about General Motors, such as how its truck heavy ICE profits fund EV and software investment or how rising EV competition and regulation might pressure margins, to explicit forecasts for revenue, earnings, margins and a fair value. You can then compare that fair value with today’s share price within Simply Wall St’s Community page, where millions of investors share views. There you can see, for example, one bullish GM Narrative that assumes a fair value of about US$120.00 and stronger long term earnings, alongside a more cautious GM Narrative closer to US$41.79 that incorporates flatter revenue and lower margins. You can also watch both update automatically as new news and earnings figures arrive.
For General Motors however, we will make it really easy for you with previews of two leading General Motors Narratives:
Fair value in this bullish Narrative: US$79.46
Implied pricing gap vs last close around US$79.05: roughly 0.5% undervalued using ((79.46 minus 79.05) divided by 79.46).
Revenue growth assumption: about 1.24% a year.
- Assumes GM continues to push EVs and U.S. manufacturing investments while using cost controls to support margins despite tariff and regulatory headwinds.
- Sees growing contributions from software and services like Super Cruise and OnStar, alongside investments in digitalization and AI to improve quality and efficiency.
- Builds in ongoing buybacks and dividends, with analysts expecting earnings to reach about US$8.0b by 2028, on a P/E of 7.7x, and a revenue line around US$185.3b under a 12.3% discount rate.
Fair value in this cautious Narrative: US$41.79
Implied pricing gap vs last close around US$79.05: roughly 47.2% overvalued using ((79.05 minus 41.79) divided by 79.05).
Revenue growth assumption: about 1.64% a year.
- Highlights uncertainty across manufacturing, operations, and product decisions, with EV investments expected to take years before making a meaningful contribution.
- Expects GM to lag parts of the industry in EV related upside, with management attention pulled toward maintaining manufacturing and organizational stability.
- Views overall revenue as relatively resilient but anticipates pressure on profit margins in the near term, with P/E improvement seen as slower than for other auto names.
Do you think there's more to the story for General Motors? Head over to our Community to see what others are saying!

This article by Simply Wall St is general in nature. We provide commentary based on historical data and analyst forecasts only using an unbiased methodology and our articles are not intended to be financial advice. It does not constitute a recommendation to buy or sell any stock, and does not take account of your objectives, or your financial situation. We aim to bring you long-term focused analysis driven by fundamental data. Note that our analysis may not factor in the latest price-sensitive company announcements or qualitative material. Simply Wall St has no position in any stocks mentioned.