Is Goldman Sachs Group (GS) Pricing Still Justified After Strong Multi Year Share Gains
Goldman Sachs Group, Inc. GS | 863.04 | +0.33% |
- If you are wondering whether Goldman Sachs Group is still attractively priced after its recent run, you are not alone. This article will walk through what the current share price might be implying about value.
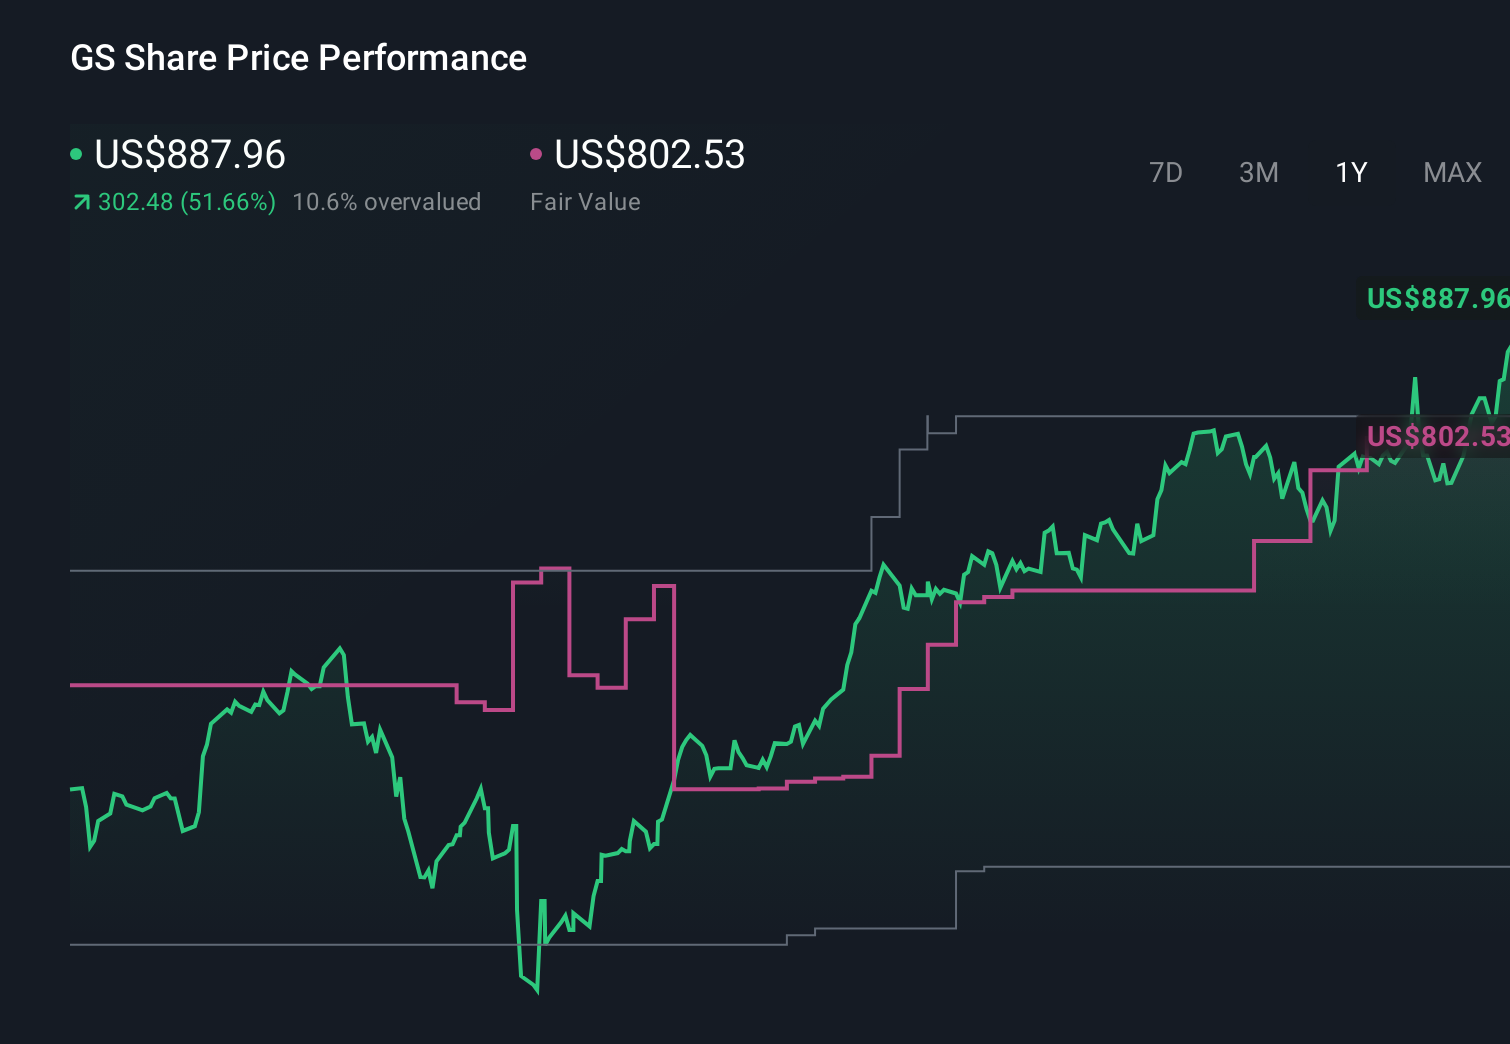
- The stock last closed at US$905.14, with returns of 39.8% over 1 year, 164.8% over 3 years and 223.0% over 5 years. The past month and year to date show declines of 5.9% and 1.0%, and there has been a 2.5% decline over the last week.
- Recent market attention around large US financial institutions and ongoing discussion of capital requirements and industry regulation has kept Goldman Sachs Group in focus. These themes help frame how investors think about risk, growth potential and what they are willing to pay for bank and investment banking names.
- On our checks, Goldman Sachs Group scores 3 out of 6 on valuation. This means it screens as undervalued on half of the metrics we track. Next we will look at what different valuation approaches say about that price, before finishing with a way to tie them together into a clearer view of value.
Approach 1: Goldman Sachs Group Excess Returns Analysis
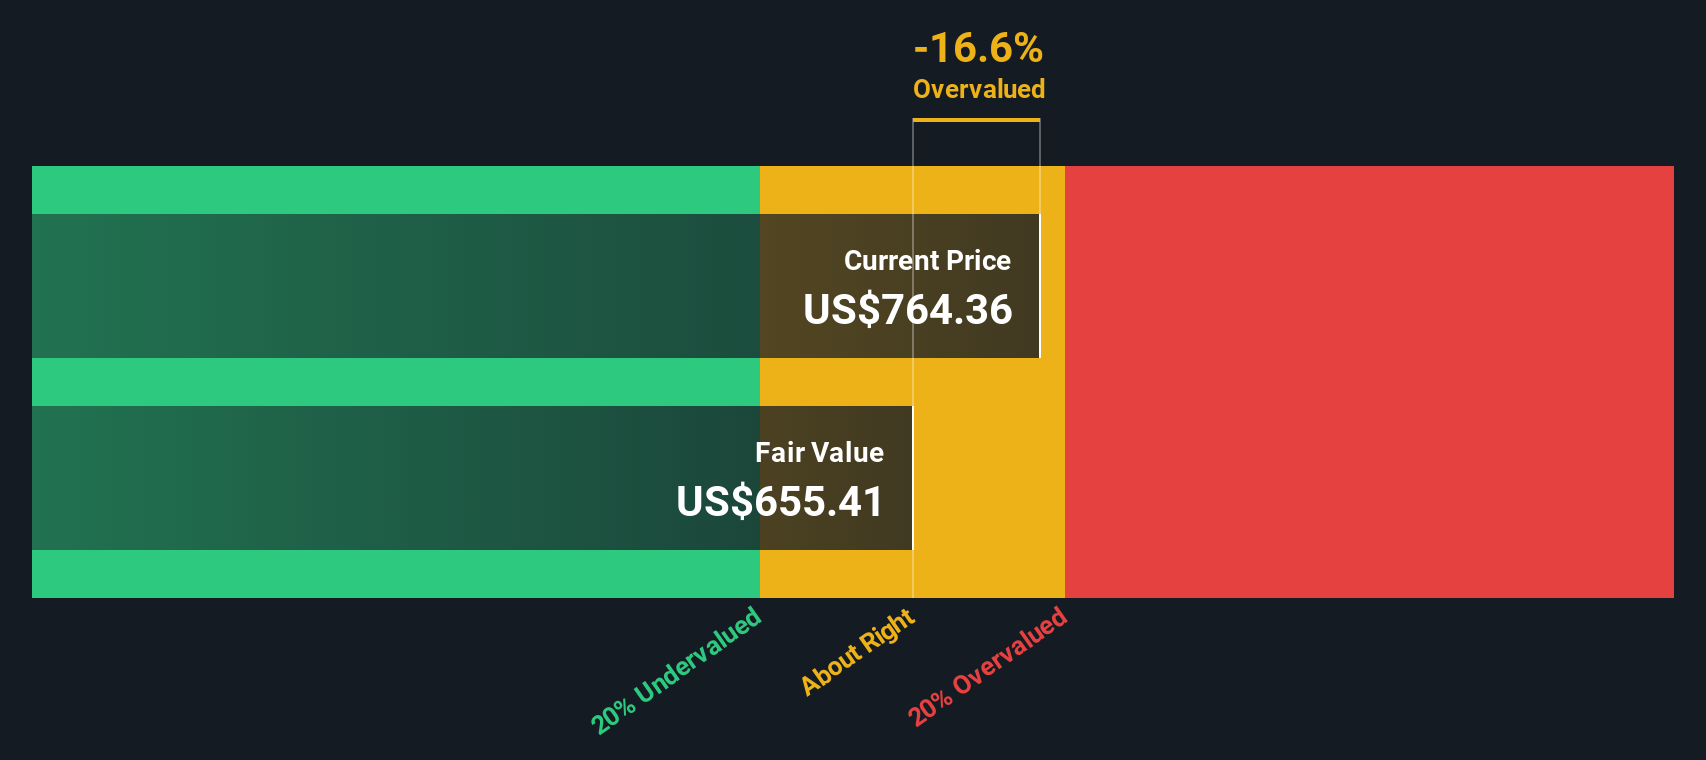
The Excess Returns model looks at how much profit Goldman Sachs Group can generate above the return that equity investors are assumed to require, then capitalizes that surplus to estimate what the shares might be worth today.
For Goldman Sachs Group, analysts estimate a stable earnings figure of $67.32 per share, based on weighted future Return on Equity forecasts from 14 analysts. The cost of equity is put at $49.61 per share, which implies an excess return of $17.72 per share. In other words, the model assumes earnings are comfortably above the required return that shareholders expect.
The model also uses a current book value of $357.46 per share and a stable book value estimate of $402.33 per share, again based on analyst inputs, together with an average Return on Equity of 16.73%. These inputs are combined to produce an intrinsic value estimate of about $600.95 per share.
Compared with the recent share price of $905.14, this Excess Returns valuation implies the stock is about 50.6% overvalued.
Result: OVERVALUED
Our Excess Returns analysis suggests Goldman Sachs Group may be overvalued by 50.6%. Discover 53 high quality undervalued stocks or create your own screener to find better value opportunities.
Approach 2: Goldman Sachs Group Price vs Earnings
For a profitable company like Goldman Sachs Group, the P/E ratio is a useful way to relate what you pay for each share to the earnings that share currently generates. It gives you a quick sense of how many dollars investors are willing to pay today for one dollar of earnings.
What counts as a "normal" or "fair" P/E depends on how the market views a company’s growth prospects and risk. Higher expected earnings growth or lower perceived risk can support a higher P/E, while lower growth or higher risk usually line up with a lower multiple.
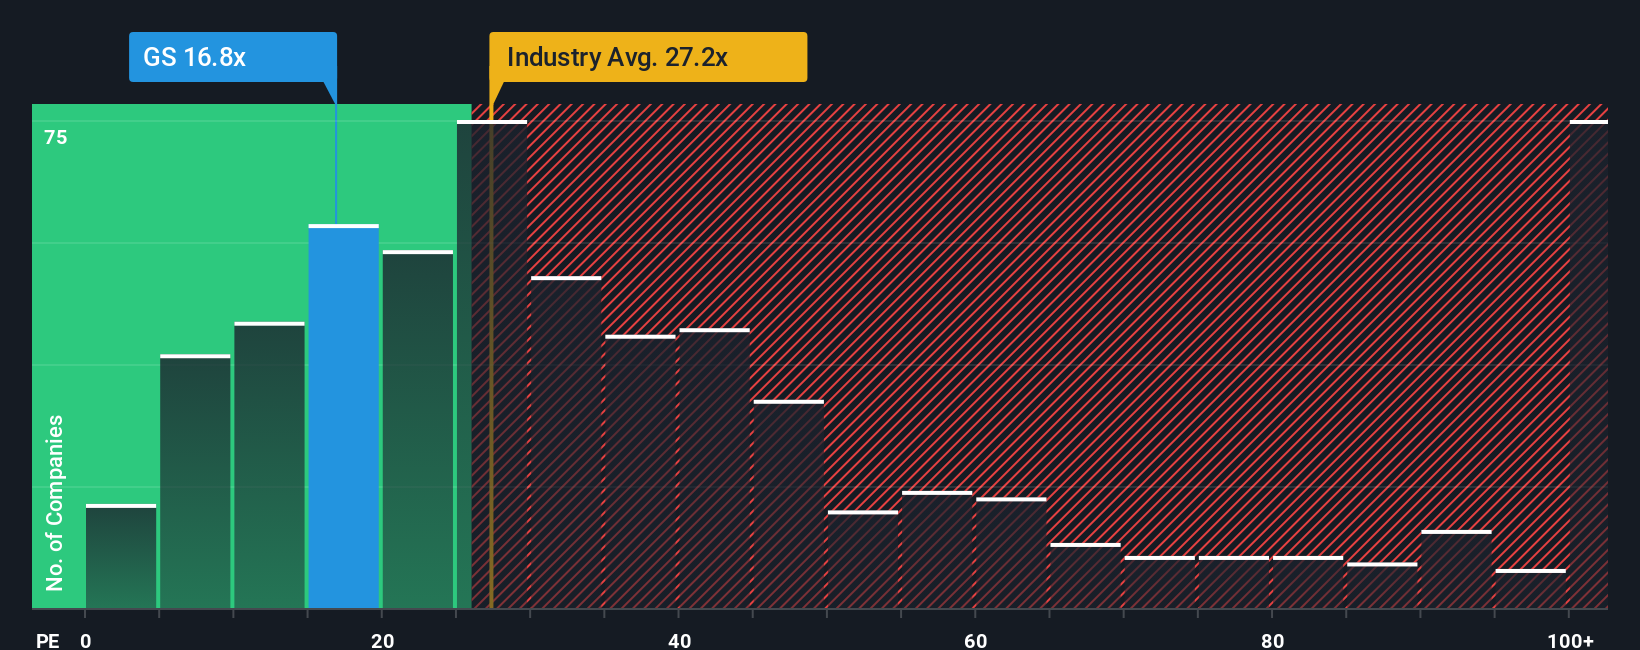
Goldman Sachs Group currently trades on a P/E of 17.42x. That compares with a Capital Markets industry average P/E of 23.12x and a peer group average of 26.66x. Simply Wall St’s Fair Ratio framework goes a step further and estimates what a more tailored P/E might look like based on factors such as earnings growth, profit margins, industry, market value and company specific risks. For Goldman Sachs Group, the Fair Ratio is 19.98x, which is higher than the current 17.42x, suggesting the shares are trading below this customized benchmark.
Result: UNDERVALUED
P/E ratios tell one story, but what if the real opportunity lies elsewhere? Start investing in legacies, not executives. Discover our 23 top founder-led companies.
Upgrade Your Decision Making: Choose your Goldman Sachs Group Narrative
Earlier we mentioned that there is an even better way to understand valuation. Let us introduce you to Narratives, where you set out your story for Goldman Sachs Group, tie that story to your own revenue, earnings and margin assumptions on the Simply Wall St Community page, and see how your Fair Value compares with the current share price. The Narrative automatically updates when new news or earnings arrive and allows, for example, one investor to lean toward a cautious fair value near US$500 while another leans toward a more optimistic figure around US$815.
For Goldman Sachs Group however we will make it really easy for you with previews of two leading Goldman Sachs Group Narratives:
Fair value: US$930.80 per share
Implied discount to this fair value at the last close: 2.8% overvaluation based on that narrative
Revenue growth assumption: 4.33% a year
- Analysts in this camp focus on advisory and asset and wealth management, where fee based revenues and alternatives are expected to support higher and more stable margins.
- They see efficiency gains from AI and digital tools, along with capital light financing businesses, as helping returns on equity and supporting flexible capital returns.
- Key watchpoints include geopolitical and regulatory changes, fee pressure in asset management and the liquidity of alternative assets.
Fair value: US$726.27 per share
Implied premium to this fair value at the last close: 24.6% overvaluation based on that narrative
Revenue growth assumption: 1.83% a year
- This group of analysts highlights digital disruption, fee compression and regulatory costs as ongoing headwinds for margins across investment banking, trading and wealth management.
- They point to slower expected revenue growth, continued reliance on more cyclical businesses and a lower future P/E multiple as reasons for a more cautious fair value.
- Upside risks to this view include continued growth in assets under supervision, demand for alternatives, technology driven cost efficiencies and ongoing buybacks and dividends.
Do you think there's more to the story for Goldman Sachs Group? Head over to our Community to see what others are saying!
This article by Simply Wall St is general in nature. We provide commentary based on historical data and analyst forecasts only using an unbiased methodology and our articles are not intended to be financial advice. It does not constitute a recommendation to buy or sell any stock, and does not take account of your objectives, or your financial situation. We aim to bring you long-term focused analysis driven by fundamental data. Note that our analysis may not factor in the latest price-sensitive company announcements or qualitative material. Simply Wall St has no position in any stocks mentioned.