

Is Gorman Rupp (GRC) Still Below Fair Value As Cash Flow Optimism Builds?
Gorman-Rupp Company GRC | 0.00 |
Gorman-Rupp (GRC) is back on investor radar after recent commentary highlighted its revenue growth, stronger free cash flow margin, and profitability trends. This has prompted a reassessment of the stock despite a relatively conservative consensus view.
Even after a sharp 6.4% decline in the latest session and a 13.0% pullback over the past week, Gorman-Rupp’s 65.8% year-to-date share price return and very strong multi year total shareholder returns indicate that momentum has been building as investors reassess its cash flow and profitability profile against a conservative consensus.
If you are reassessing Gorman-Rupp and want more ideas in industrial and infrastructure related themes, it may be worth scanning 35 power grid technology and infrastructure stocks
Bulls argue Gorman-Rupp’s earnings, cash generation, and shareholder returns justify the run, while bears point to the pullback and discount to the consensus target. Which side does the current valuation actually support?
Price-to-Earnings of 35.9x: Is It Justified for Gorman-Rupp?
On a headline basis, Gorman-Rupp looks expensive with a P/E of 35.9x, while the SWS DCF model points to a fair value of $114.10 versus the last close at $79.82.
The P/E ratio compares the current share price to earnings per share and is often used to gauge how much investors are willing to pay for each dollar of profit. For Gorman-Rupp, the P/E of 35.9x sits above both the US Machinery industry average of 28.3x and the peer group average of 33.2x, which suggests the market is assigning a premium to its earnings profile.
That premium sits against several pieces of context. Earnings grew 32.4% over the past year and have grown 19.6% per year over the past five years. At the same time, forecasts indicate revenue growth of 3.9% per year, which is slower than both the wider US Machinery industry and the US market, and Gorman-Rupp carries a high level of debt funded entirely by higher risk borrowing rather than customer deposits.
Compared to the estimated fair P/E of 24.6x, Gorman-Rupp’s current 35.9x multiple is meaningfully higher, so there is a sizable gap between what the market is currently paying and the level that regression analysis suggests the P/E could move toward over time.
Result: Price-to-Earnings of 35.9x (OVERVALUED)
However, Gorman-Rupp’s high P/E, strong recent share price performance and reliance on higher risk borrowing mean any slowdown in revenue or earnings could quickly challenge the current bullish narrative.
Another View: What The SWS DCF Model Says About Gorman-Rupp
While the P/E of 35.9x makes Gorman-Rupp look expensive, the SWS DCF model paints a different picture. It shows an estimated fair value of $114.10 versus the current $79.82, which implies the stock trades at about a 30% discount. Which signal should carry more weight for you?
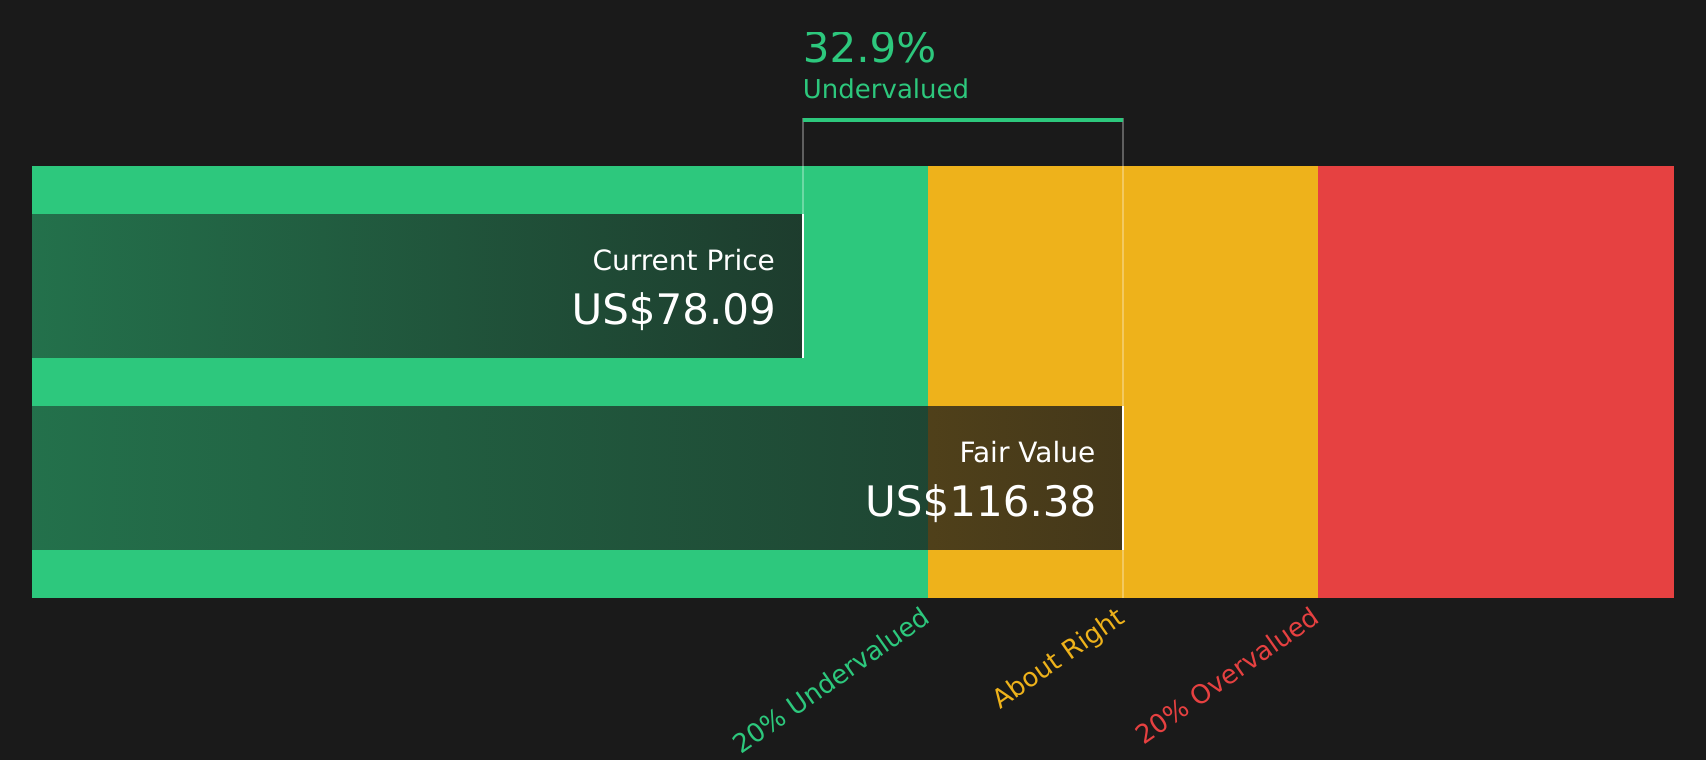
Simply Wall St performs a discounted cash flow (DCF) on every stock in the world every day (check out Gorman-Rupp for example). We show the entire calculation in full. You can track the result in your watchlist or portfolio and be alerted when this changes, or use our stock screener to discover 45 high quality undervalued stocks. If you save a screener we even alert you when new companies match - so you never miss a potential opportunity.
Next Steps
The mix of enthusiasm around Gorman-Rupp’s cash flow and earnings, together with concern about its borrowing and valuation, makes this a nuanced story. Look at the underlying data, pressure test the assumptions, and weigh both sides by reviewing the 3 key rewards and 1 important warning sign
Looking For More Investment Ideas Beyond Gorman-Rupp?
If you are reassessing Gorman-Rupp, do not stop with a single stock. Broaden your watchlist now so you are not relying on one story alone.
- Spot potential value opportunities early by reviewing companies in the 45 high quality undervalued stocks and see which stocks the numbers suggest may be pricing in too much pessimism.
- Strengthen your downside protection by focusing on businesses in the 74 resilient stocks with low risk scores that pair resilient fundamentals with lower risk profiles.
- Get ahead of the crowd by scanning the screener containing 18 high quality undiscovered gems and finding quality ideas that are not yet widely followed.
This article by Simply Wall St is general in nature. We provide commentary based on historical data and analyst forecasts only using an unbiased methodology and our articles are not intended to be financial advice. It does not constitute a recommendation to buy or sell any stock, and does not take account of your objectives, or your financial situation. We aim to bring you long-term focused analysis driven by fundamental data. Note that our analysis may not factor in the latest price-sensitive company announcements or qualitative material. Simply Wall St has no position in any stocks mentioned.