Is Halliburton (HAL) Offering Value After Recent 17.4% Share Price Jump?
Halliburton Company HAL | 38.17 | +0.45% |
- If you are wondering whether Halliburton is attractively priced or already reflects its prospects, this article will walk through what the current numbers suggest about the stock's value.
- Halliburton recently closed at US$32.57, with a return of 17.4% over the last 30 days, 10.0% year to date, 12.2% over the past year, a 14.3% decline over three years, and an 85.2% gain over five years.
- Recent news around Halliburton has largely focused on its role as a major oilfield services provider and how investor sentiment in the energy sector feeds into trading activity in large, liquid names like this. That context helps frame the share price moves you are seeing across different time frames.
- On our valuation checks, Halliburton scores 4 out of 6. This points to several areas where the stock screens as potentially undervalued and a couple where the picture is more balanced. Next, we look at how different methods arrive at that view, then finish with a way to tie all these valuation tools together.
Approach 1: Halliburton Discounted Cash Flow (DCF) Analysis
A Discounted Cash Flow, or DCF, model estimates what a company might be worth by projecting its future cash flows and then discounting those back to today using a required return. It is essentially asking what those future dollars are worth in today’s terms.
For Halliburton, the model used is a 2 Stage Free Cash Flow to Equity approach, built on cash flow projections in US$. The latest twelve month Free Cash Flow is about US$1.89b. Analyst estimates and subsequent extrapolations feed into a ten year path, with projected Free Cash Flow of US$2.76b in 2030 and discounted values for each year from 2026 to 2035 supplied by Simply Wall St.
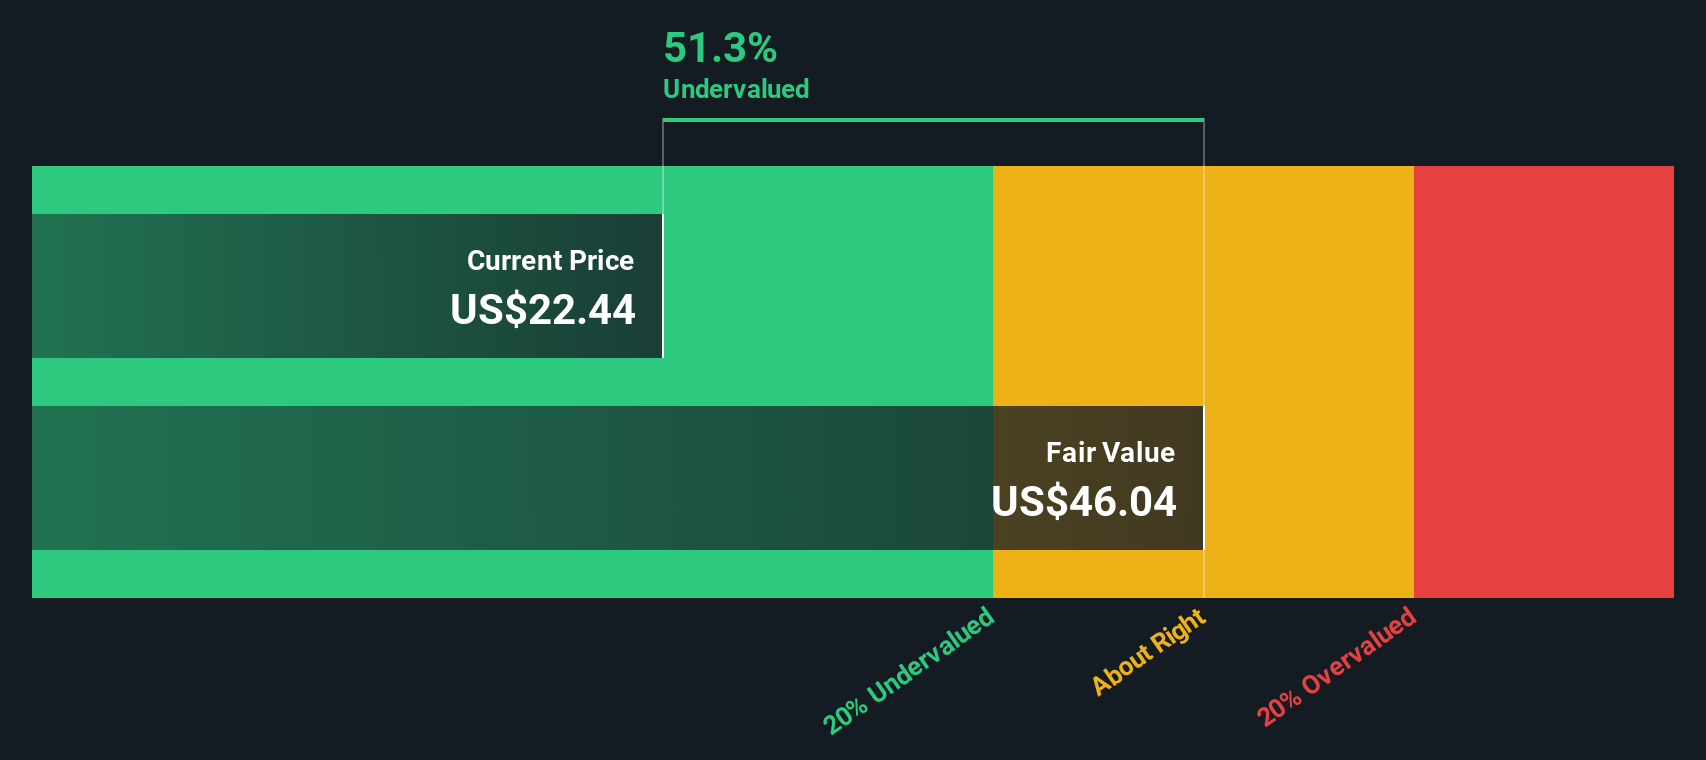
When all those discounted cash flows are added together, the model arrives at an estimated intrinsic value of US$72.06 per share. Compared with the recent share price of US$32.57, this implies a 54.8% discount. On this DCF view alone, Halliburton appears to be trading at a materially lower level than the model’s intrinsic value estimate.
Result: UNDERVALUED
Our Discounted Cash Flow (DCF) analysis suggests Halliburton is undervalued by 54.8%. Track this in your watchlist or portfolio, or discover 863 more undervalued stocks based on cash flows.
Approach 2: Halliburton Price vs Earnings
For a profitable company like Halliburton, the P/E ratio is a useful shorthand because it links what you are paying directly to the earnings the business is generating today. Investors usually accept a higher or lower P/E depending on what they expect for future growth and how much risk they see in those earnings.
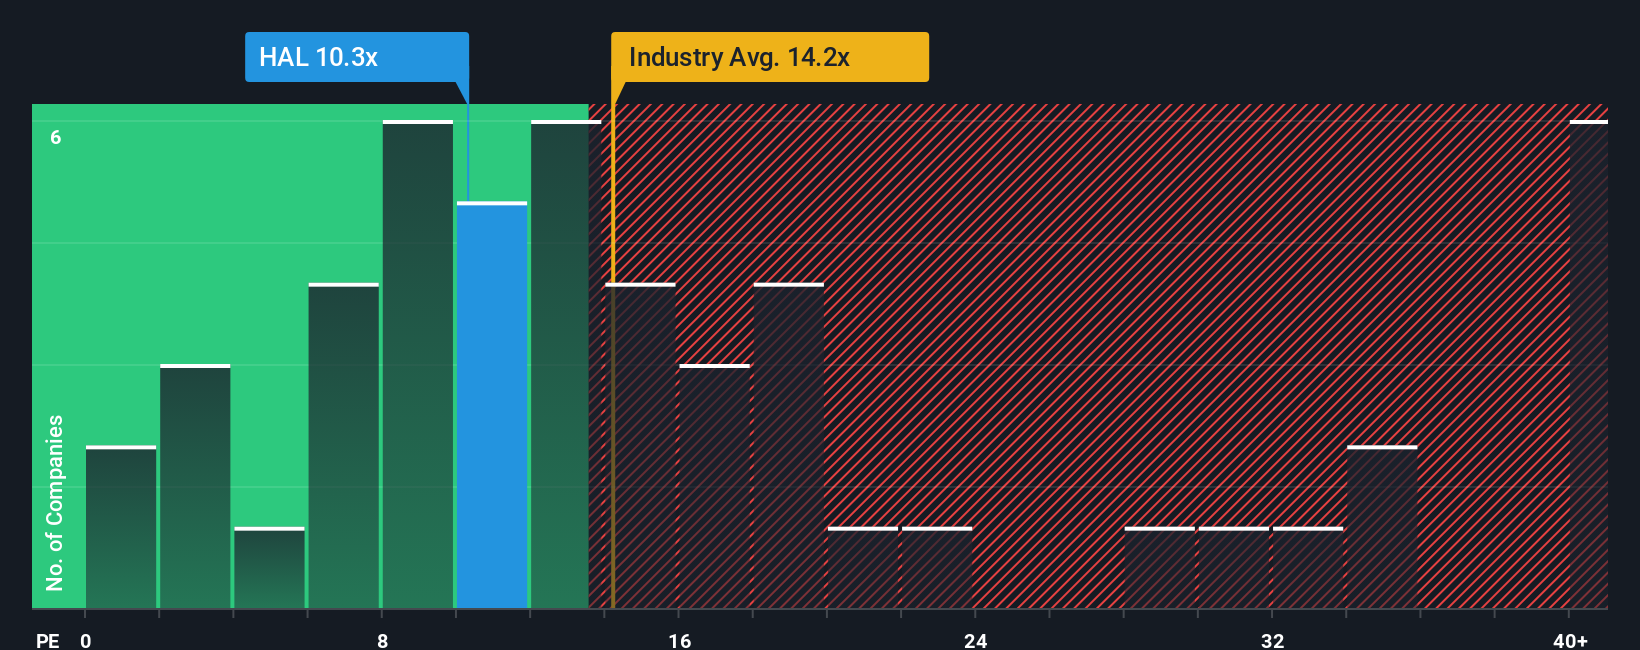
Halliburton currently trades on a P/E of 20.94x. That sits close to both the Energy Services industry average P/E of 21.21x and the peer average of 18.33x, so on simple comparisons the shares are in the same general range as similar companies.
Simply Wall St also calculates a Fair Ratio, which is the P/E level it would expect for Halliburton given factors such as earnings growth, industry, profit margins, market cap and identified risks. For Halliburton, this Fair Ratio is 21.16x. This approach goes further than a basic peer or industry check because it adjusts for the company’s own profile rather than assuming all Energy Services names deserve the same multiple.
Compared with the Fair Ratio of 21.16x, Halliburton’s actual P/E of 20.94x is slightly lower, which points to the shares screening as mildly undervalued on this metric.
Result: UNDERVALUED
P/E ratios tell one story, but what if the real opportunity lies elsewhere? Discover 1445 companies where insiders are betting big on explosive growth.
Upgrade Your Decision Making: Choose your Halliburton Narrative
Earlier we mentioned that there is an even better way to understand valuation. Let us introduce Narratives, which let you tell a clear story about Halliburton by linking your view of its future revenues, earnings and margins to a financial forecast, then to a fair value. You can do this using an easy tool on Simply Wall St's Community page that compares your Fair Value with the current share price and automatically refreshes when new news or earnings arrive. For Halliburton, one investor might build a Narrative that leans toward the higher fair value of US$35.00 based on stronger power demand and oilfield activity, while another might anchor closer to US$20.00 because they focus more on energy transition and regulatory risks. Both of those stories can sit side by side on the platform so you can see how different assumptions lead to different conclusions about whether the stock looks expensive or cheap to you personally.
Do you think there's more to the story for Halliburton? Head over to our Community to see what others are saying!
This article by Simply Wall St is general in nature. We provide commentary based on historical data and analyst forecasts only using an unbiased methodology and our articles are not intended to be financial advice. It does not constitute a recommendation to buy or sell any stock, and does not take account of your objectives, or your financial situation. We aim to bring you long-term focused analysis driven by fundamental data. Note that our analysis may not factor in the latest price-sensitive company announcements or qualitative material. Simply Wall St has no position in any stocks mentioned.