Is ICON (ICLR) Offering An Opportunity After The Recent 50% Share Price Slide
ICON Plc ICLR | 116.78 | +0.24% |
- If you are wondering whether ICON's current share price still reflects its underlying value, you are not alone. This article is built to help you connect the stock price to what the business may be worth.
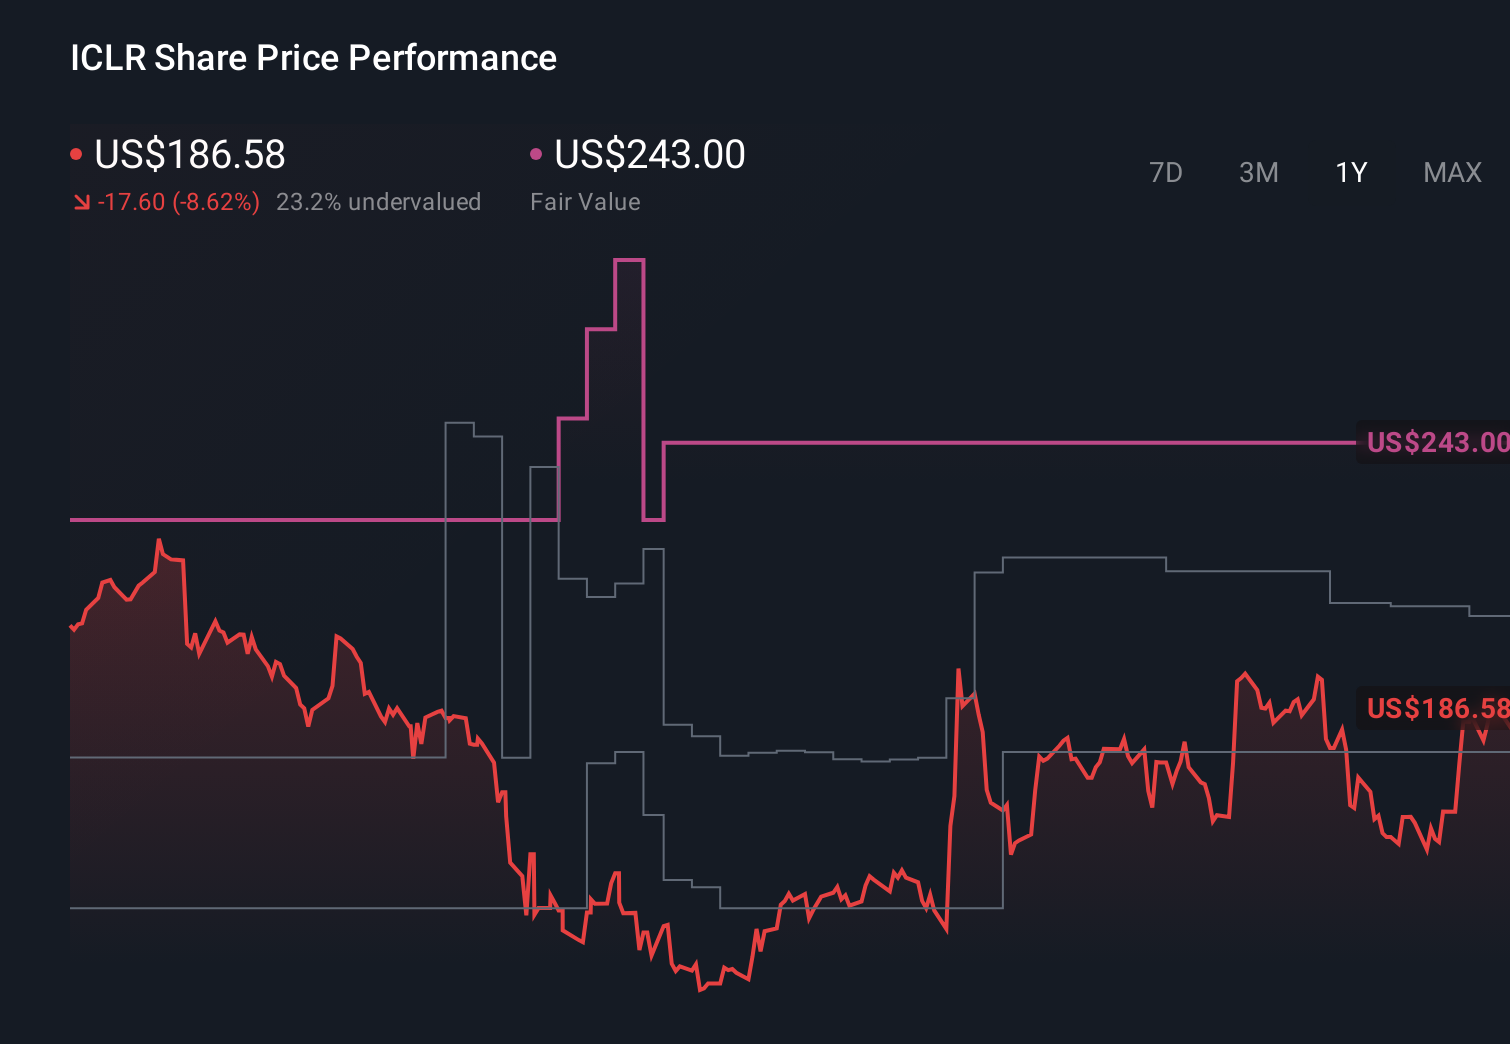
- ICON's share price closed at US$93.00, with returns of a 38.2% decline over 7 days, a 49.7% decline over 30 days, a 50.7% decline year to date, a 50.1% decline over 1 year, a 59.1% decline over 3 years, and a 55.3% decline over 5 years, which may have changed how some investors think about both its potential and its risks.
- Recent coverage around ICON has focused on how the business is being priced in the market, with investors paying closer attention to the relationship between expectations and the current share price. That context matters when you weigh whether the recent share price levels line up with the underlying fundamentals that valuation models try to capture.
- On our six point valuation checklist, ICON scores a 5 out of 6, which suggests the stock screens as undervalued on most of the measures we track. Next, we will walk through the main valuation approaches behind that score and introduce an even richer way to think about value at the end of the article.
Approach 1: ICON Discounted Cash Flow (DCF) Analysis
A Discounted Cash Flow model takes estimates of the cash a business could generate in the future, then discounts those back into today’s dollars to arrive at an intrinsic value per share.
For ICON, the latest twelve month Free Cash Flow is reported at about $980.9 million. Analysts and internal estimates project Free Cash Flow out to 2035, with 2030 forecast at $1,267.95 million. Estimates through 2030 combine analyst forecasts for earlier years and extrapolations by Simply Wall St for the later period, using a 2 Stage Free Cash Flow to Equity model.
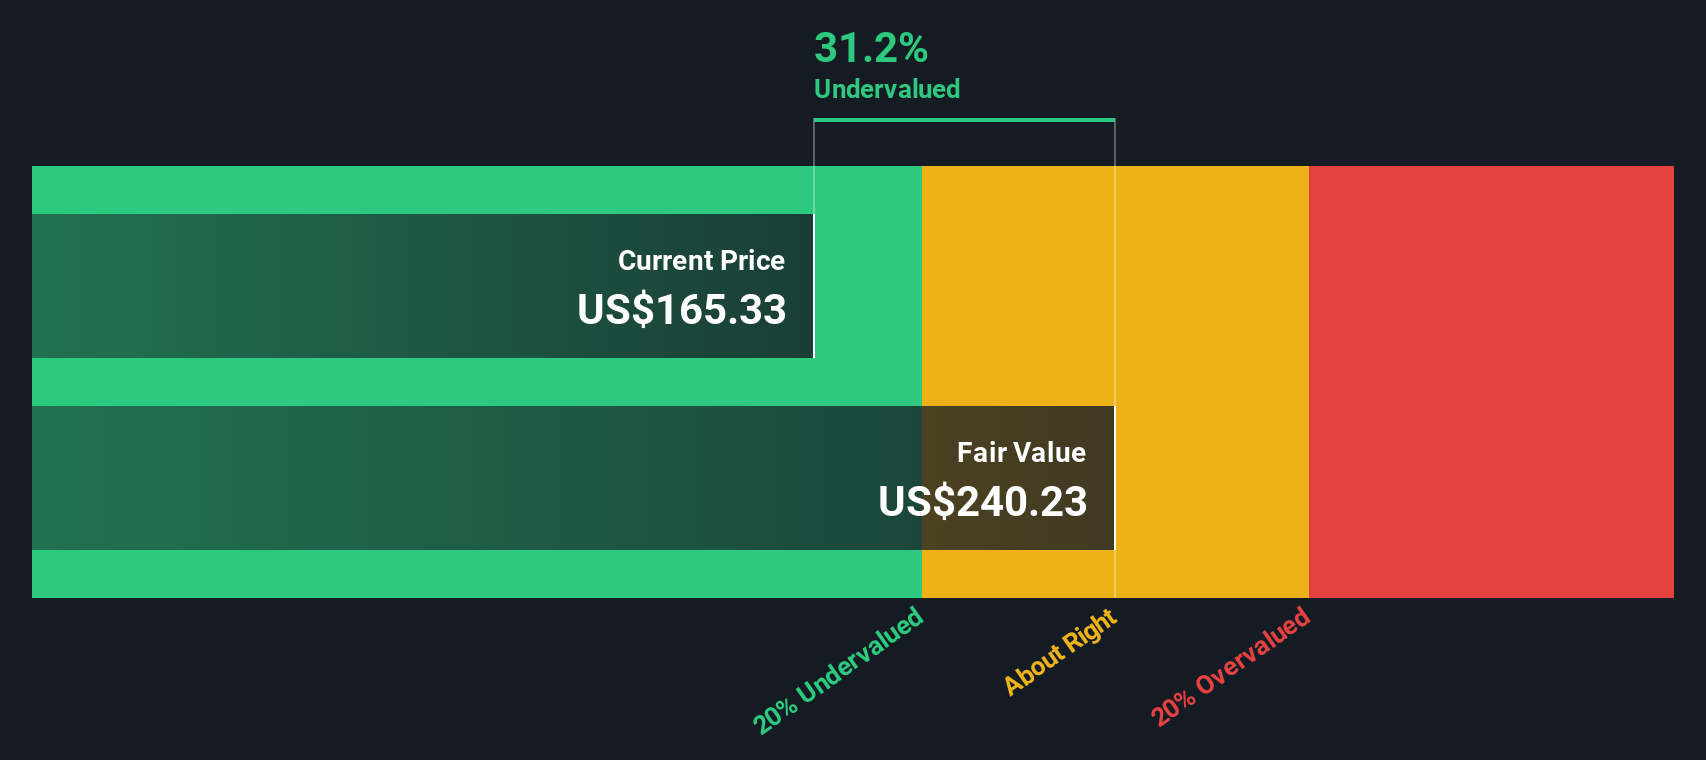
When those projected cash flows are discounted back to today, the DCF model arrives at an estimated intrinsic value of about $228.48 per share. Compared with the recent share price of $93.00, this implies the stock is about 59.3% undervalued based on these assumptions and inputs.
Result: UNDERVALUED
Our Discounted Cash Flow (DCF) analysis suggests ICON is undervalued by 59.3%. Track this in your watchlist or portfolio, or discover 53 more high quality undervalued stocks.
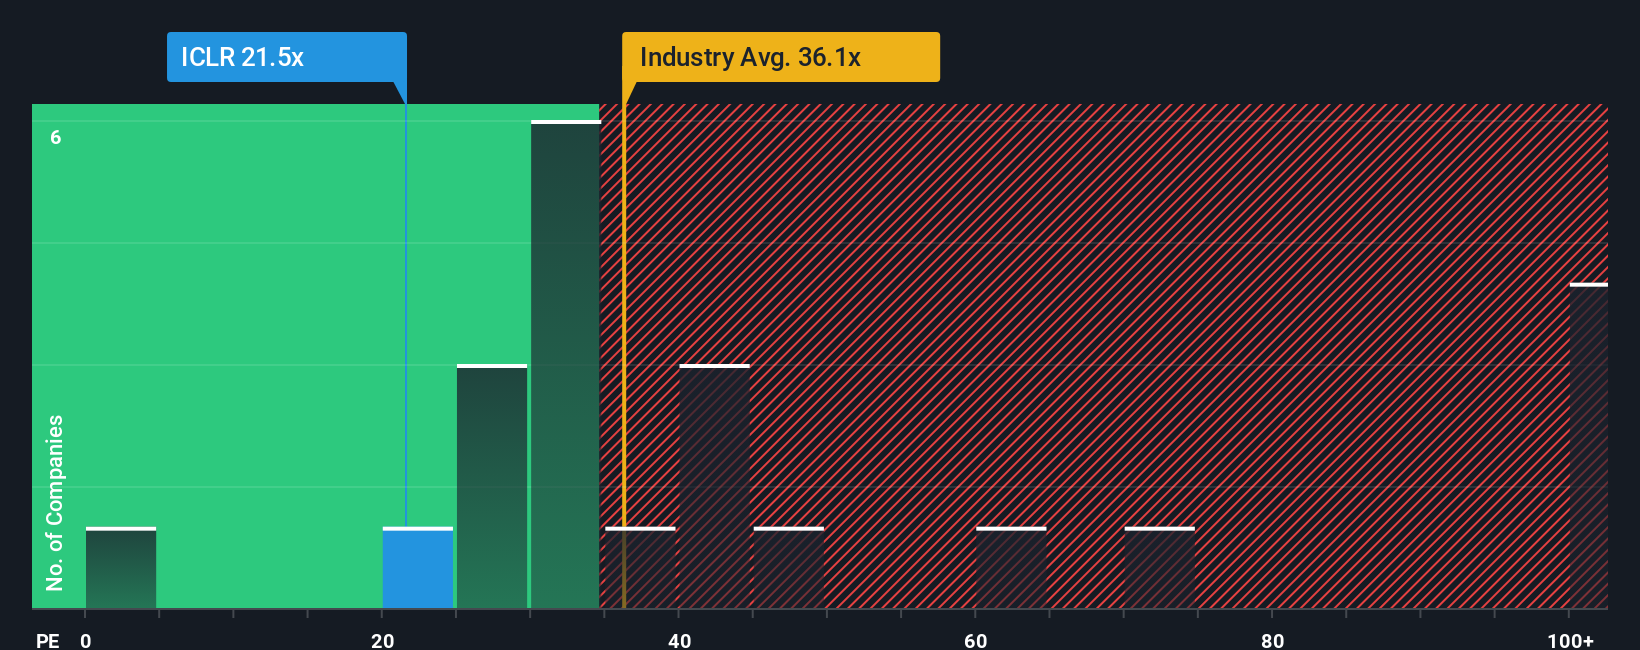
Approach 2: ICON Price vs Earnings
For profitable companies like ICON, the P/E ratio is a useful way to connect what you pay for each share with the earnings that company is currently generating. It helps you see how many dollars investors are willing to pay today for one dollar of current earnings.
What counts as a "normal" or "fair" P/E depends on how the market views a company’s growth prospects and risks. Higher expected growth or lower perceived risk can support a higher P/E, while lower growth expectations or higher risk usually line up with a lower P/E.
ICON currently trades on a P/E of 11.85x. That is well below the Life Sciences industry average of about 34.85x and the peer group average of 55.50x. Simply Wall St’s Fair Ratio framework, which estimates what the P/E might be given factors such as earnings growth, profit margins, industry, market cap and risks, points to a Fair Ratio of 22.27x for ICON. This tailored yardstick can be more informative than a simple comparison with industry or peers because it attempts to adjust for company specific characteristics.
Comparing the current P/E of 11.85x with the Fair Ratio of 22.27x suggests ICON screens as undervalued on this measure.
Result: UNDERVALUED
P/E ratios tell one story, but what if the real opportunity lies elsewhere? Start investing in legacies, not executives. Discover our 23 top founder-led companies.
Upgrade Your Decision Making: Choose your ICON Narrative
Earlier we mentioned that there is an even better way to understand valuation, so Narratives on Simply Wall St let you attach your own story about ICON to the numbers by tying your assumptions for future revenue, earnings and margins to a fair value that you can compare with the current price.
In practice, a Narrative is your view of how ICON’s oncology expansion, AI tools like iSubmit and SmartDraft, cancellation risks, competition and capital allocation might play out over time, translated into a forecast and then into a fair value that updates automatically when new earnings or news arrive.
On the Simply Wall St Community page you can see different ICON Narratives side by side. For example, one uses a fair value of about US$226.60 and another is closer to US$163.85. You can use that spread to judge where your own expectations sit and how the gap between your fair value and the US$93.00 market price may inform your decision to buy, hold or sell.
Do you think there's more to the story for ICON? Head over to our Community to see what others are saying!
This article by Simply Wall St is general in nature. We provide commentary based on historical data and analyst forecasts only using an unbiased methodology and our articles are not intended to be financial advice. It does not constitute a recommendation to buy or sell any stock, and does not take account of your objectives, or your financial situation. We aim to bring you long-term focused analysis driven by fundamental data. Note that our analysis may not factor in the latest price-sensitive company announcements or qualitative material. Simply Wall St has no position in any stocks mentioned.