

Is Interactive Brokers Group (IBKR) Stock Too Rich After Its Expansion Move?
Interactive Brokers Group, Inc. Class A IBKR | 0.00 |
Interactive Brokers Group has delivered a very large 5 year return, yet the current valuation checks and intrinsic value estimate from the Excess Returns model both lean toward the stock trading at a premium to its fundamentals. Recent price softness contrasts with a strong multi year run, which puts more focus on whether that premium can be justified.
- Over the past 5 years, Interactive Brokers Group has returned about 466%, which puts extra weight on whether today’s price already reflects much of that success.
- The recent move to offer clients access to the Bucharest Stock Exchange can support expectations for further growth in trading volumes, while any slowdown in client activity or weaker revenue trends may weigh on what investors are willing to pay for the stock.
- Interactive Brokers Group passes only 1 of 6 valuation checks, which points to a company that currently looks expensive rather than like a clear bargain on the broader measures.
The issue now is whether Interactive Brokers Group’s share price around US$89.85 is outpacing what the intrinsic value estimate and valuation checks can support.
Is Interactive Brokers Group Getting Expensive on Excess Returns?
The Excess Returns model evaluates how much profit Interactive Brokers Group can earn on its equity above its estimated cost of capital. For this stock, the focus is on whether those extra returns justify the current share price.
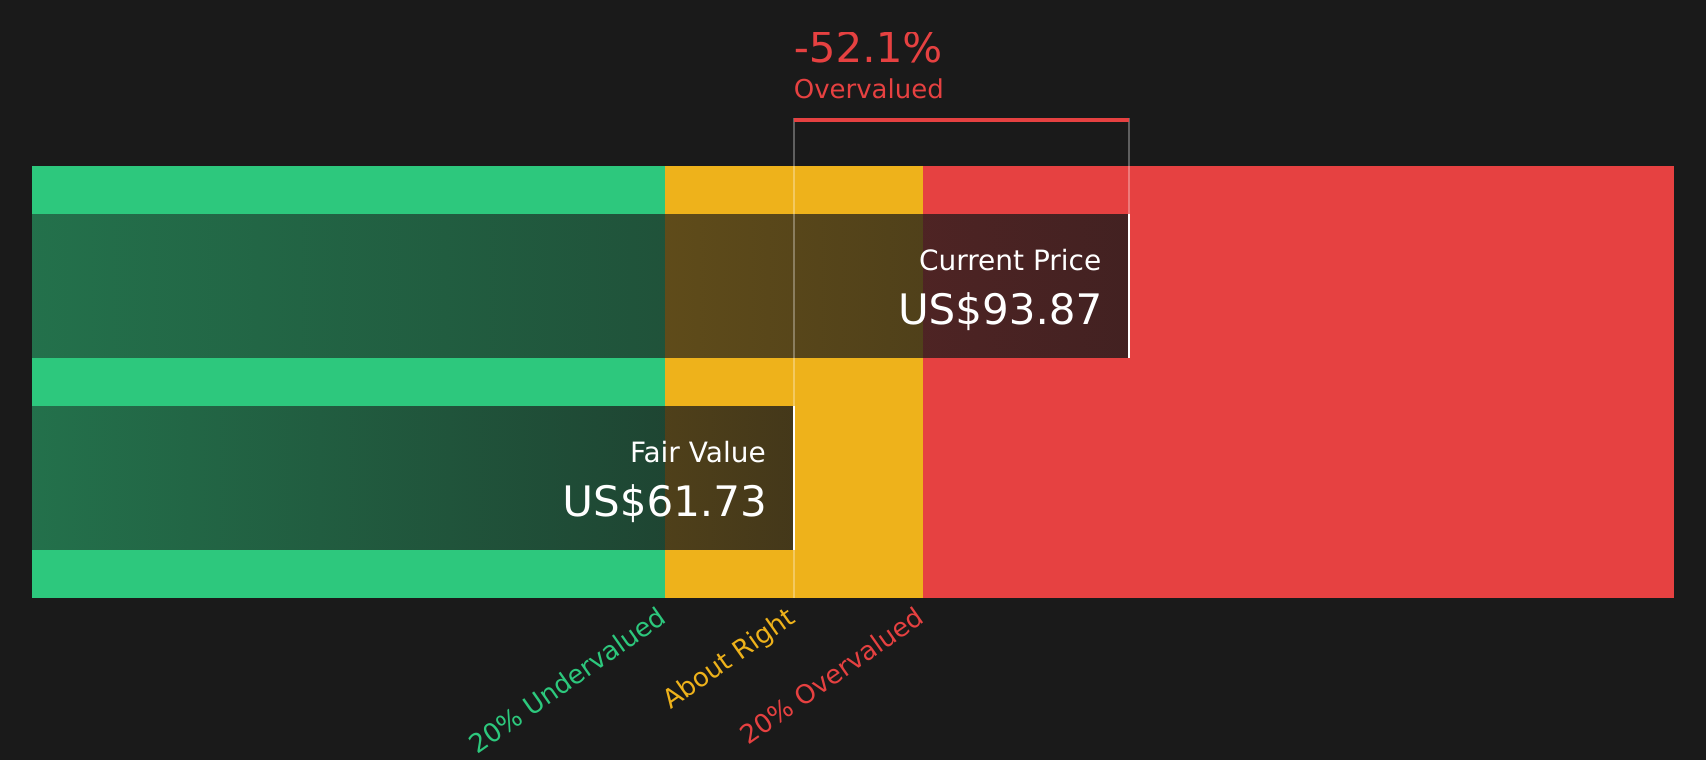
The model uses a book value of $13.10 per share and a stable EPS estimate of $3.59 per share, based on the median return on equity from the past 5 years. With a cost of equity of $1.48 per share, this implies an excess return of $2.11 per share and an average return on equity of 20.53%. Combined with a stable book value estimate of $17.47 per share from two analysts, the Excess Returns framework arrives at an intrinsic value of about $61.72 per share.
Against the current price around $89.85, Interactive Brokers Group screens as about 45.6% above this intrinsic value estimate, so the stock appears overvalued according to this model. The recent move to add access to the Bucharest Stock Exchange may support the business story; however, the model indicates that the market is already pricing in a generous level of future returns.
On the Excess Returns view, Interactive Brokers Group currently screens as overvalued relative to its estimated intrinsic value.
Our Excess Returns analysis suggests Interactive Brokers Group may be overvalued by 45.6%. Discover 50 high quality undervalued stocks or create your own screener to find better value opportunities.
Is Interactive Brokers Group Getting Expensive on Earnings?
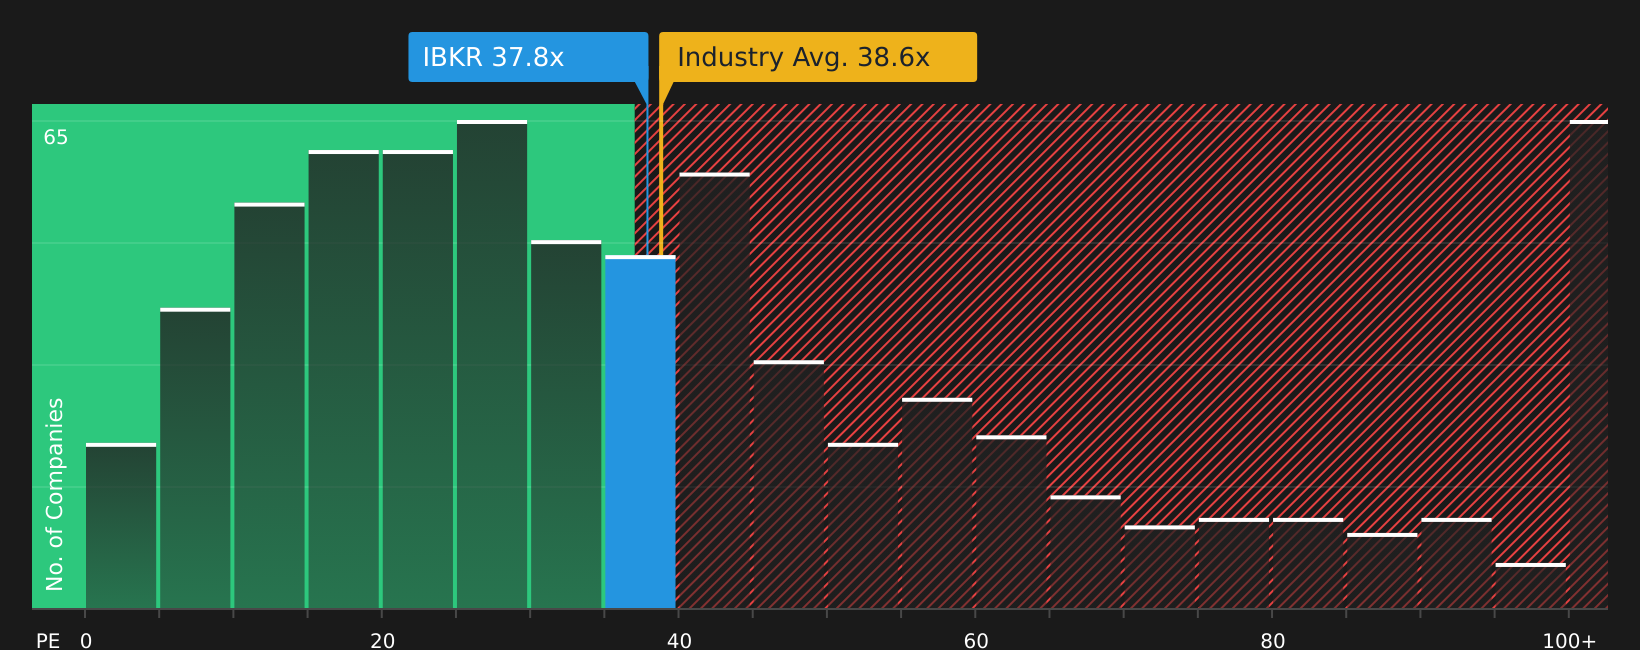
P/E is a useful yardstick for Interactive Brokers Group because earnings are a key driver for brokerages and trading platforms. Interactive Brokers Group currently trades on a P/E of about 36.2x, compared with a peer average of 23.2x and an industry average of 38.5x for the wider Capital Markets group. That places the stock above its closer peer group even though it sits slightly below the broader industry level.
The tailored fair P/E ratio from the model is 23.0x, which reflects what investors might typically pay given Interactive Brokers Group’s size, margins and risk profile. The current 36.2x multiple stands well above this fair ratio, which points to investors paying a sizable premium for each dollar of earnings. This premium comes on top of the excess returns model already flagging a price that is rich relative to its intrinsic value estimate.
On the P/E multiple, Interactive Brokers Group screens as overvalued because the current earnings valuation sits well above both its modelled fair ratio and the peer group average.
The Interactive Brokers Group Narrative: What Would Justify Today's Price?
Simply Wall St Narratives for Interactive Brokers Group pick up where this valuation puzzle leaves off and set out the specific growth, margin and earnings paths that would make the stock worth materially more or less than today’s price. Each narrative links its number to a clear view on how Interactive Brokers Group's growth, profitability and risks could evolve, which you can revisit as new information comes through on the Community page.
The community is split on Interactive Brokers Group, with one side seeing meaningful upside and the other flagging a rich setup.
Bull case: 16% undervalued
"The partnership with HSBC for the HSBC WorldTrader offering powered by Interactive Brokers, along with the development of other potential client pipelines, points toward significant expansion opportunities in new markets, potentially increasing market share and diversifying revenue streams through commissions and interest income."
Bear case: 496% overvalued
"Another risk to monitor is interest rate sensitivity."
Do you think there's more to the story for Interactive Brokers Group? Head over to our Community to see what others are saying!
The Bottom Line
For Interactive Brokers Group, both the intrinsic value estimate from the Excess Returns model and the earnings multiple point to an overvalued stock today. The very large gap to the intrinsic value estimate and the premium P/E suggest expectations are already demanding after a strong 5 year period. With broader valuation checks also weak, the key question is whether Interactive Brokers Group can sustain the level of profitability and client activity that current pricing assumes. The debate now rests on how long those economics hold and whether the market is willing to keep paying this kind of premium for them.
This article by Simply Wall St is general in nature. We provide commentary based on historical data and analyst forecasts only using an unbiased methodology and our articles are not intended to be financial advice. It does not constitute a recommendation to buy or sell any stock, and does not take account of your objectives, or your financial situation. We aim to bring you long-term focused analysis driven by fundamental data. Note that our analysis may not factor in the latest price-sensitive company announcements or qualitative material. Simply Wall St has no position in any stocks mentioned.