Is It Time to Consider Airbnb After Regulatory News and a 10% Dip This Year?
Airbnb, Inc. ABNB | 126.28 127.16 | 0.00% +0.70% Pre |
Thinking about what to do with your Airbnb stock? You’re definitely not alone. The share price has been on a bit of a rollercoaster lately, edging down by 0.8% last week and off by 3.0% over the last month. Year to date, Airbnb is down 9.6%, and over the past year the stock has slipped 10.8%. Still, if you zoom out to the last three years, there’s a glimmer of green with a modest gain of 0.8%. That is no small feat given some of the headwinds travel and tech stocks have faced recently.
If you’re wondering what’s fueling these moves, much of it ties back to shifting views on travel demand and the regulatory landscape for short-term rentals. Investors have become more cautious as several cities around the world rethink rules on home-sharing. There is also excitement about Airbnb’s ability to find growth in new markets and ride the broader travel recovery.
So where does that leave valuation? By the numbers, Airbnb’s value score currently sits at 4 out of a possible 6. This reflects that the company appears undervalued across four key checks usually used by analysts. That is not a perfect score, but it provides some support, especially in a market that has been punishing high-growth stories that cannot prove their worth.
Next up, we’ll break down how each of those core valuation methods stacks up for Airbnb, so you can see where the score comes from. If you’re looking for an even more revealing way to assess value, don’t worry, we’ll get there before the end.
Approach 1: Airbnb Discounted Cash Flow (DCF) Analysis
The Discounted Cash Flow (DCF) model estimates a company’s intrinsic value by projecting future cash flows and discounting them back to today’s value. This method allows investors to see what the business could be worth if those future earnings come to pass.
For Airbnb, the latest twelve months’ Free Cash Flow (FCF) stands at $4.31 billion. Analyst estimates suggest that this figure is expected to grow over time, reaching approximately $6.76 billion in 2029. While FCF projections for the next five years are grounded in analyst coverage, forecasts beyond that are extrapolated. The methodology assumes the company can maintain healthy cash generation as it matures in the coming decade.
Using these cash flow projections, the DCF model calculates an intrinsic share value of $209.70. Compared to Airbnb’s current share price, this indicates the stock is trading at a 43.3% discount. In other words, markets may be underestimating Airbnb’s future profit potential.
Result: UNDERVALUED
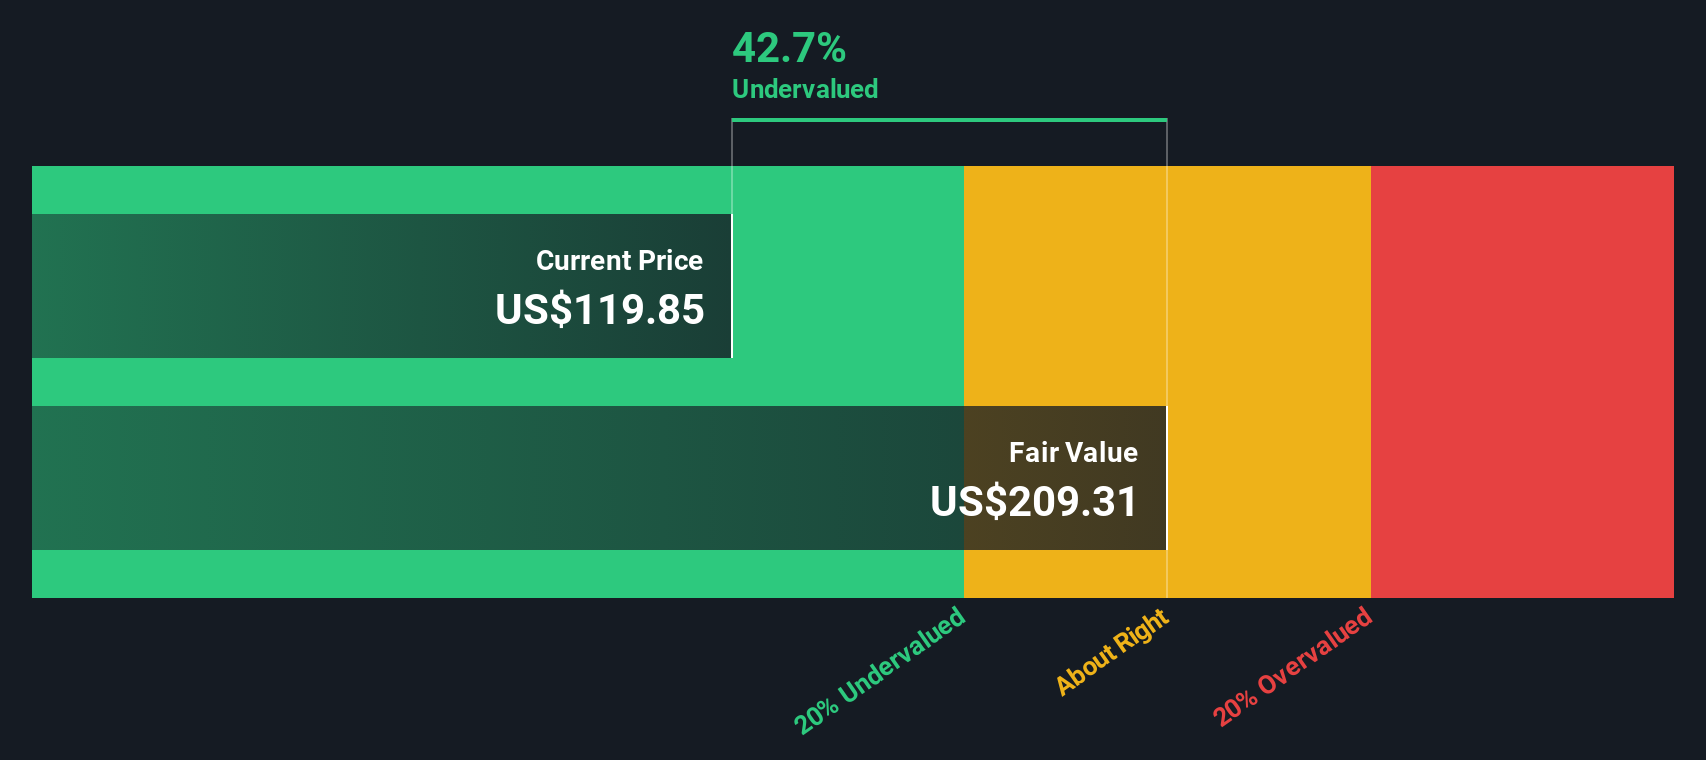
Our Discounted Cash Flow (DCF) analysis suggests Airbnb is undervalued by 43.3%. Track this in your watchlist or portfolio, or discover more undervalued stocks.
Approach 2: Airbnb Price vs Earnings (PE Ratio)
The price-to-earnings (PE) ratio is one of the most widely used methods to value profitable companies like Airbnb, since it links the company’s share price to its actual earnings. The PE ratio tells investors how much they’re paying for each dollar of earnings, and is especially helpful when comparing mature or profitable companies within the same industry.
Growth expectations and company risk both play important roles in determining what constitutes a normal or fair PE ratio. Fast-growing companies or those with low risk often command higher PE ratios, as investors are willing to pay more for future growth. Conversely, slower-growing or riskier businesses tend to have lower PE ratios.
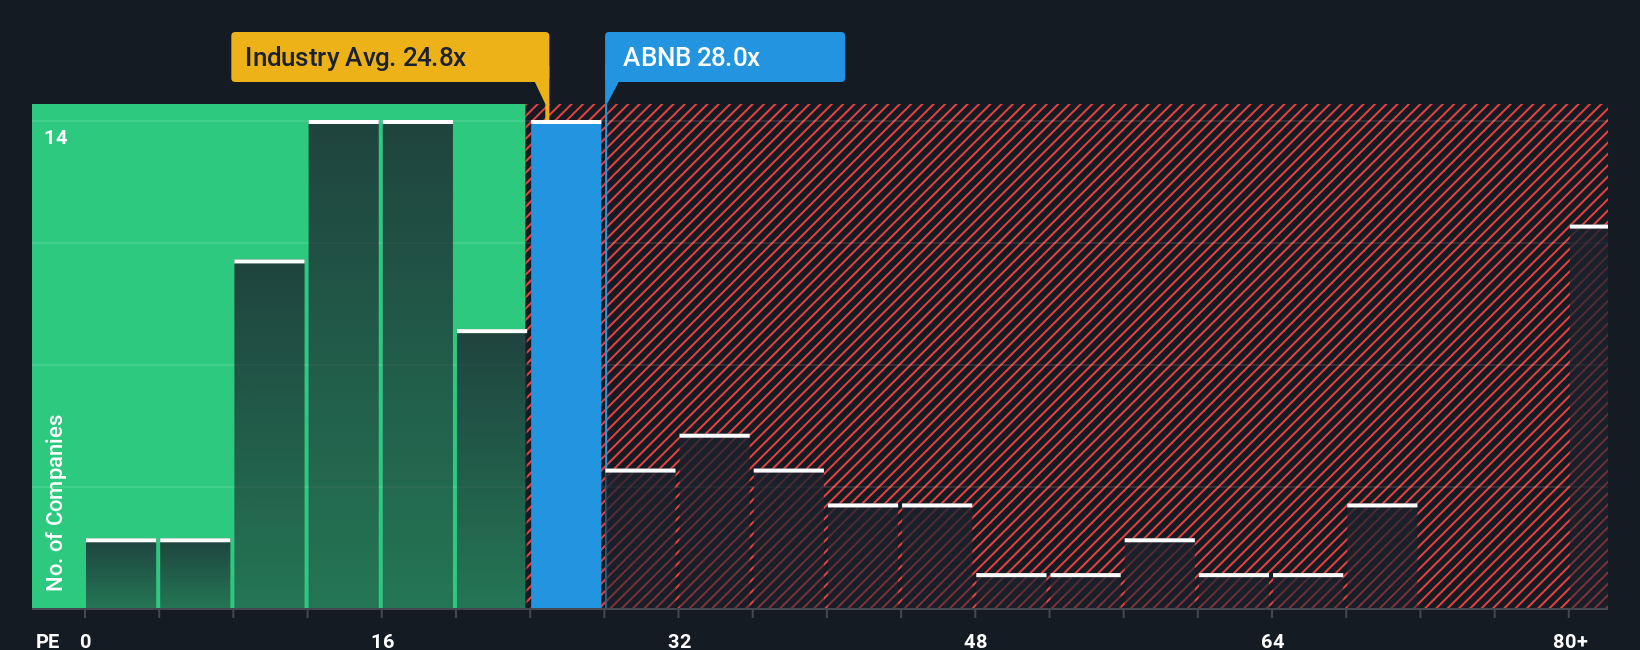
Currently, Airbnb trades at a PE ratio of 27.7x. This is above the Hospitality industry average of 23.1x, but below its peer group average of 31.6x. To offer a more tailored assessment, Simply Wall St calculates a proprietary “Fair Ratio” for Airbnb of 30.9x. This Fair Ratio factors in not just Airbnb’s earnings growth but also considerations like its market cap, profit margins, and sector-specific risks.
Unlike broad industry or peer comparisons, the Fair Ratio provides a more nuanced benchmark by accounting for Airbnb’s unique position and outlook. In Airbnb’s case, its current PE ratio is just a bit below the Fair Ratio, suggesting investors are paying about the right price for its earnings given its prospects.
Result: ABOUT RIGHT
PE ratios tell one story, but what if the real opportunity lies elsewhere? Discover companies where insiders are betting big on explosive growth.
Upgrade Your Decision Making: Choose your Airbnb Narrative
Earlier we mentioned that there is an even better way to understand valuation, so let's introduce you to Narratives. A Narrative is simply your story about Airbnb, an easy, dynamic way to explain the numbers you believe in, such as your estimated fair value, future revenue, or profit margins, all linked directly to your view of the business’s future.
This approach connects what you think will happen (the company’s story), the numbers that back it up (your forecast), and your own fair value, making your investment decision more personal and actionable. Narratives are available to everyone on Simply Wall St’s Community page, used by millions, and they update automatically whenever new information, like news or earnings, comes in.
Best of all, Narratives help answer the key question: is Airbnb a buy or sell today? By comparing what you think the fair value should be versus the current price, you get real-time insight driven by your own perspective, not just analyst averages.
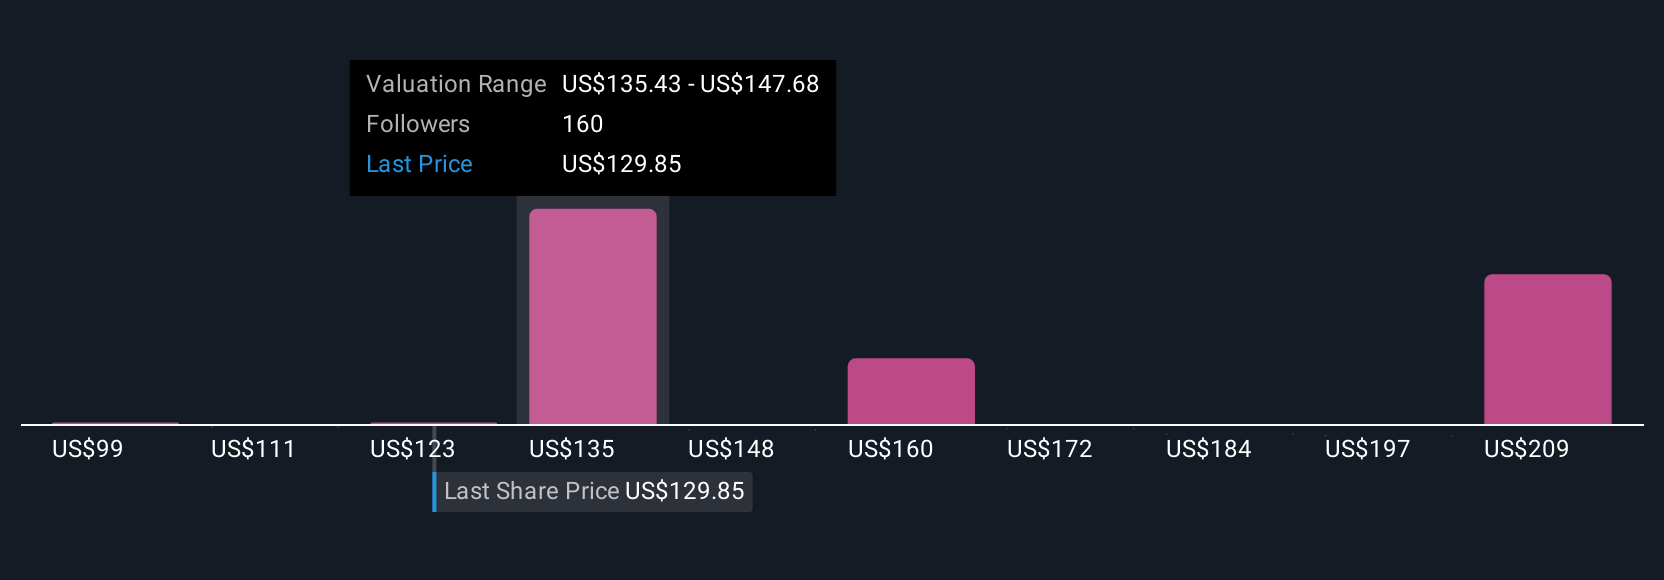
For example, while some investors see Airbnb’s fair value as high as $181 based on expected rapid international growth and new services, others set it closer to $98 due to concerns around regulation and slowing markets. What story do you believe?
Do you think there's more to the story for Airbnb? Create your own Narrative to let the Community know!
This article by Simply Wall St is general in nature. We provide commentary based on historical data and analyst forecasts only using an unbiased methodology and our articles are not intended to be financial advice. It does not constitute a recommendation to buy or sell any stock, and does not take account of your objectives, or your financial situation. We aim to bring you long-term focused analysis driven by fundamental data. Note that our analysis may not factor in the latest price-sensitive company announcements or qualitative material. Simply Wall St has no position in any stocks mentioned.