Is It Time To Reassess 3M (MMM) After Restructuring And Mixed Share Price Performance
3M Company MMM | 0.00 |
- If you are wondering whether 3M at around US$143 a share still lines up with the value you are looking for, this breakdown will help you see how the current price compares with a range of valuation checks.
- The stock is up 1.2% over the last week, although it is down 4.7% over the last month, 11.5% year to date and 2.9% over the past year, with a very large 3 year return and a flat 0.1% return over 5 years, hinting at a mixed recent experience for shareholders.
- Recent headlines around 3M have focused on the company’s restructuring efforts and portfolio changes, as well as ongoing attention on legal and operational updates. Together these factors help frame how investors are thinking about both risk and potential, and give important context for why the stock has moved the way it has across different timeframes.
- Right now, 3M scores a 4/6 valuation score. The next sections will walk through what that means across different methods and then finish with a broader way to think about value that goes beyond any single model.
Approach 1: 3M Discounted Cash Flow (DCF) Analysis
A Discounted Cash Flow model estimates what a stock could be worth by projecting the cash the company is expected to generate in the future and then discounting those amounts back to today.
For 3M, the model used is a 2 Stage Free Cash Flow to Equity approach. The latest twelve month free cash flow is about $1.79b. Analysts provide explicit free cash flow estimates for several years, and Simply Wall St then extrapolates further, with projected free cash flow of $4.94b in 2030 based on those inputs. All of these future cash flows are discounted back to today using the model’s assumptions.
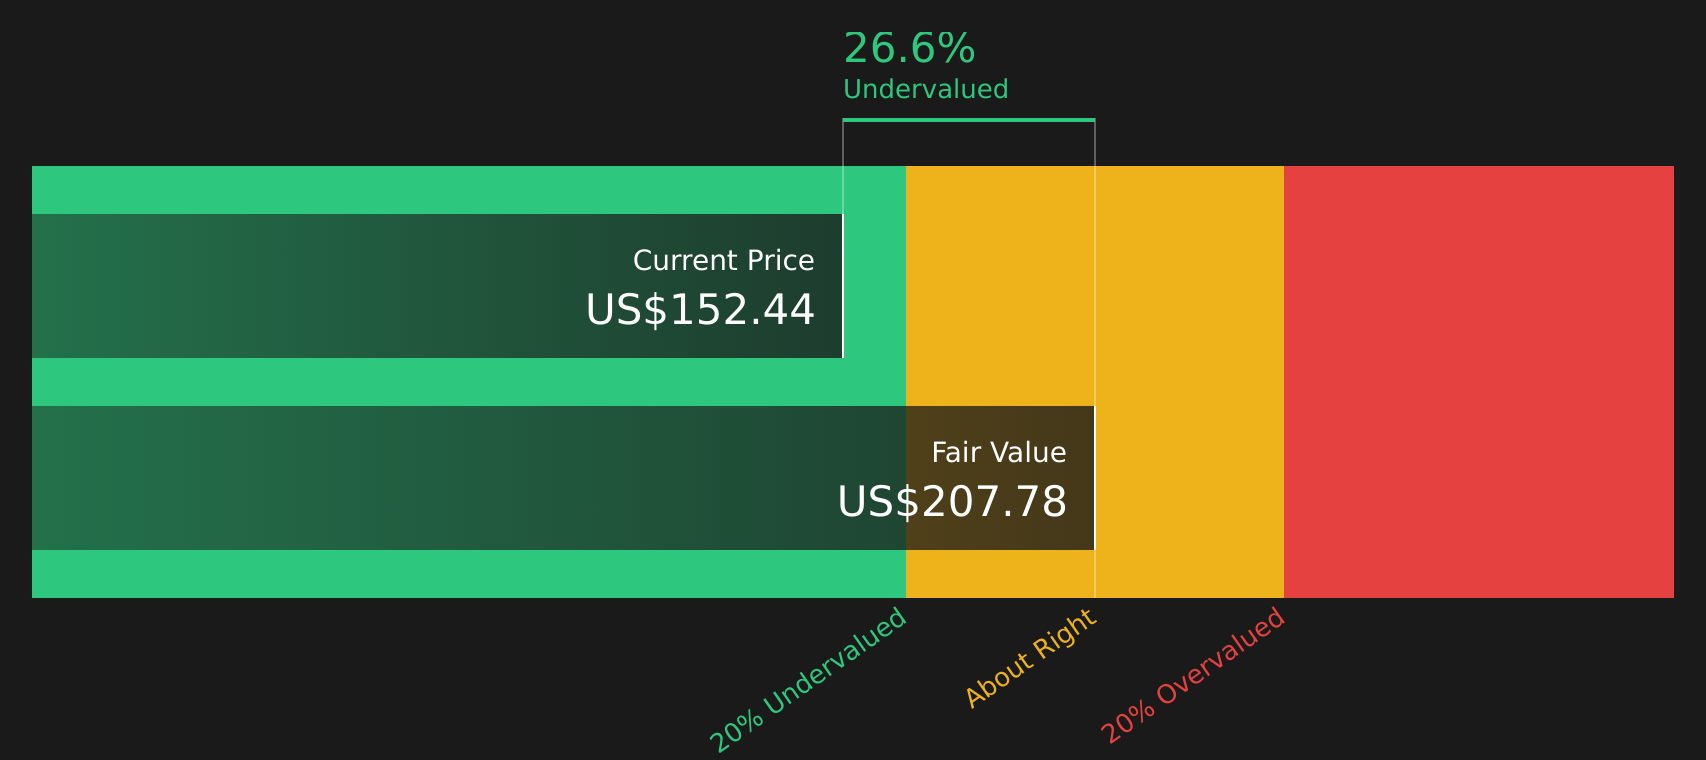
On this basis, the estimated intrinsic value for 3M is $207.23 per share, compared with the current share price of around $143. This implies the stock is 30.9% undervalued according to this DCF framework.
Result: UNDERVALUED
Our Discounted Cash Flow (DCF) analysis suggests 3M is undervalued by 30.9%. Track this in your watchlist or portfolio, or discover 49 more high quality undervalued stocks.
Approach 2: 3M Price vs Earnings
For profitable companies like 3M, the P/E ratio is a straightforward way to see how much investors are paying for each dollar of earnings. It connects directly to what you, as a shareholder, receive over time: the stream of earnings that the company can either reinvest or return through dividends and buybacks.
A higher or lower P/E often reflects what the market expects around future growth and how much risk investors see in those earnings. Strong, stable earnings with lower perceived risk are usually associated with a higher “normal” or “fair” P/E, while more uncertainty or weaker profitability tends to align with a lower one.
3M currently trades on a P/E of 26.8x, compared with an Industrials sector average of about 14.5x and a peer group average of 24.7x. Simply Wall St also calculates a “Fair Ratio” of 33.8x for 3M. This Fair Ratio is a proprietary measure that estimates what the P/E might be given factors such as earnings growth, industry, profit margin, market cap and company specific risks. Because it incorporates these elements directly, it can offer a more tailored reference point than simply comparing against peers or the industry alone. On this basis, 3M’s current P/E sits below its Fair Ratio.
Result: UNDERVALUED

P/E ratios tell one story, but what if the real opportunity lies elsewhere? Start investing in legacies, not executives. Discover our 19 top founder-led companies.
Upgrade Your Decision Making: Choose your 3M Narrative
Earlier it was mentioned that there is an even better way to understand valuation. Narratives pull everything together by letting you attach a clear story about 3M, including your view on its future revenue, earnings and margins, to a financial forecast and a Fair Value. You can then compare that Fair Value with the current price to decide whether the stock looks attractive or stretched.
On Simply Wall St’s Community page, Narratives are easy to use and update automatically when new information arrives, such as earnings or PFAS litigation news. This means you always see how fresh data affects your story and valuation.
For example, one investor could align with the more bullish view that 3M might justify a Fair Value near US$223.59, while another might lean toward the more cautious end closer to US$113.59. Narratives make those different perspectives transparent so you can see exactly which assumptions sit behind each view instead of relying only on headline targets.
For 3M, we will make it really easy for you with previews of two leading 3M Narratives:
Fair value in this bullish narrative: US$175.03 per share.
At a last close of US$143.29, the price sits about 18.1% below this narrative fair value.
Revenue growth assumption: 2.77% a year.
- Analysts in this camp see 3M using product launches, higher R&D focus and operational efficiency work to support higher margins and earnings from here.
- The narrative leans on ongoing PFAS legal management, free cash flow and share buybacks as support for financial flexibility and value creation.
- To line up with this view, you would need to be comfortable with revenue of about US$27.2b and earnings of about US$4.7b by 2029, on a future P/E of 21.9x using a discount rate around 7.7%.
Fair value in this bearish narrative: US$125.70 per share.
At a last close of US$143.29, the price sits about 14.0% above this narrative fair value.
Revenue growth assumption: 1.16% a year.
- This narrative focuses on PFAS and other environmental litigation, regulatory pressure and portfolio restructuring as ongoing drags on free cash flow, margins and valuation.
- It also highlights risks from supply chain complexity, potential product restrictions and R&D effectiveness, which together could cap revenue growth and limit earnings power.
- To align with this view, you would need to see fair value closer to US$113.59 based on revenue of about US$25.1b and earnings of about US$4.7b by 2028, on a future P/E of 15.2x with a discount rate near 7.7%.
These two Narratives give you a clear range for what different analysts think 3M could be worth and why, so you can decide which set of assumptions is closer to your own view before taking the next step in your research.
To see how these results tie into long-term growth, risks, and valuation, check out the full range of community narratives for 3M on Simply Wall St. Add the company to your watchlist or portfolio so you'll be alerted when the story evolves.
Do you think there's more to the story for 3M? Head over to our Community to see what others are saying!

This article by Simply Wall St is general in nature. We provide commentary based on historical data and analyst forecasts only using an unbiased methodology and our articles are not intended to be financial advice. It does not constitute a recommendation to buy or sell any stock, and does not take account of your objectives, or your financial situation. We aim to bring you long-term focused analysis driven by fundamental data. Note that our analysis may not factor in the latest price-sensitive company announcements or qualitative material. Simply Wall St has no position in any stocks mentioned.