Is It Time To Reassess Alnylam Pharmaceuticals (ALNY) After Recent RNAi Pipeline Progress?
Alnylam Pharmaceuticals, Inc ALNY | 322.11 322.11 | +0.26% 0.00% Pre |
- If you are wondering whether Alnylam Pharmaceuticals' current share price lines up with its underlying value, this article will walk through what the numbers are really saying.
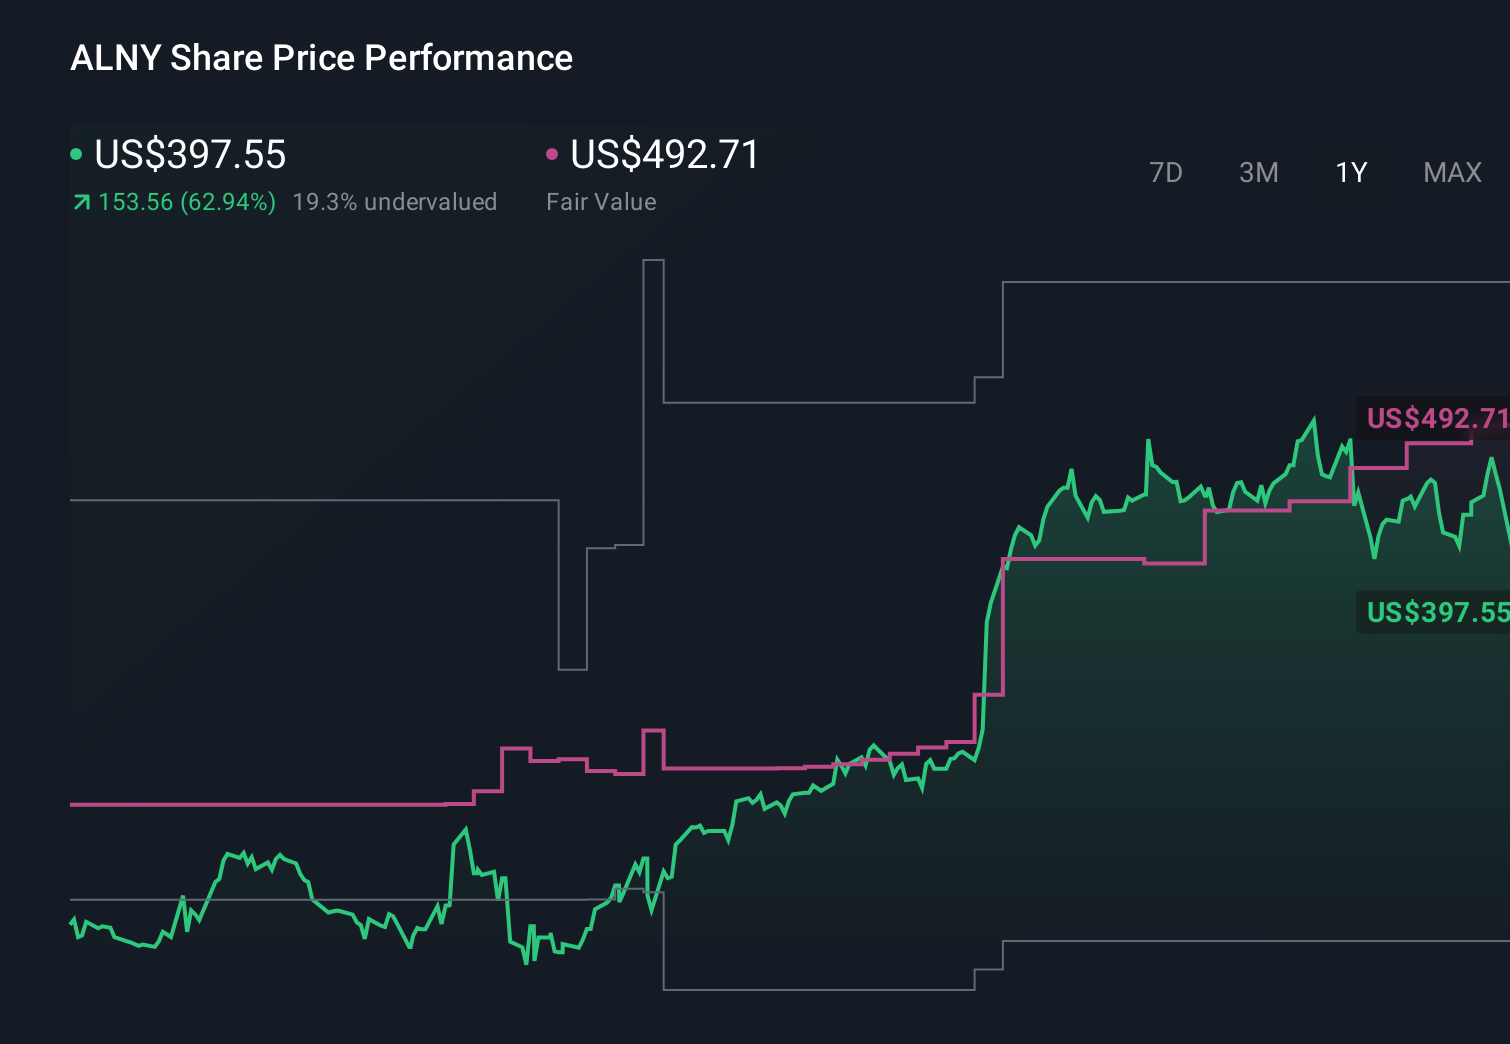
- The stock last closed at US$359.27, with a 1 year return of 45.9% and a 5 year return of 108.4%. Over shorter periods, the share price has seen a 7 day return of a 9.8% decline and a 30 day return of a 9.3% decline, with a year to date return of a 10.2% decline.
- Recent news around Alnylam has focused on its RNA interference based drug pipeline, regulatory milestones, and ongoing clinical trial updates. These factors often influence how investors think about future cash flows and risk. They also provide useful context for the recent share price moves and help frame expectations that feed into valuation work.
- On our valuation checks, Alnylam currently scores 4 out of 6. This raises some clear questions about how different valuation methods treat a company like this, and whether a more complete approach to valuation, which we will come back to at the end, can give you a more rounded view of the stock.
Approach 1: Alnylam Pharmaceuticals Discounted Cash Flow (DCF) Analysis
A Discounted Cash Flow, or DCF, model estimates what a company might be worth today by projecting its future cash flows and discounting them back to the present using a required return.
For Alnylam Pharmaceuticals, the model used is a 2 Stage Free Cash Flow to Equity approach. The latest twelve month free cash flow is about $195.7m. Analysts and extrapolated estimates point to projected free cash flow of $4.45b in 2030, with intermediate years between 2026 and 2035 ranging from around $1.62b to $6.41b before discounting. These cash flows are all calculated in US dollars and are then discounted to reflect timing and risk.
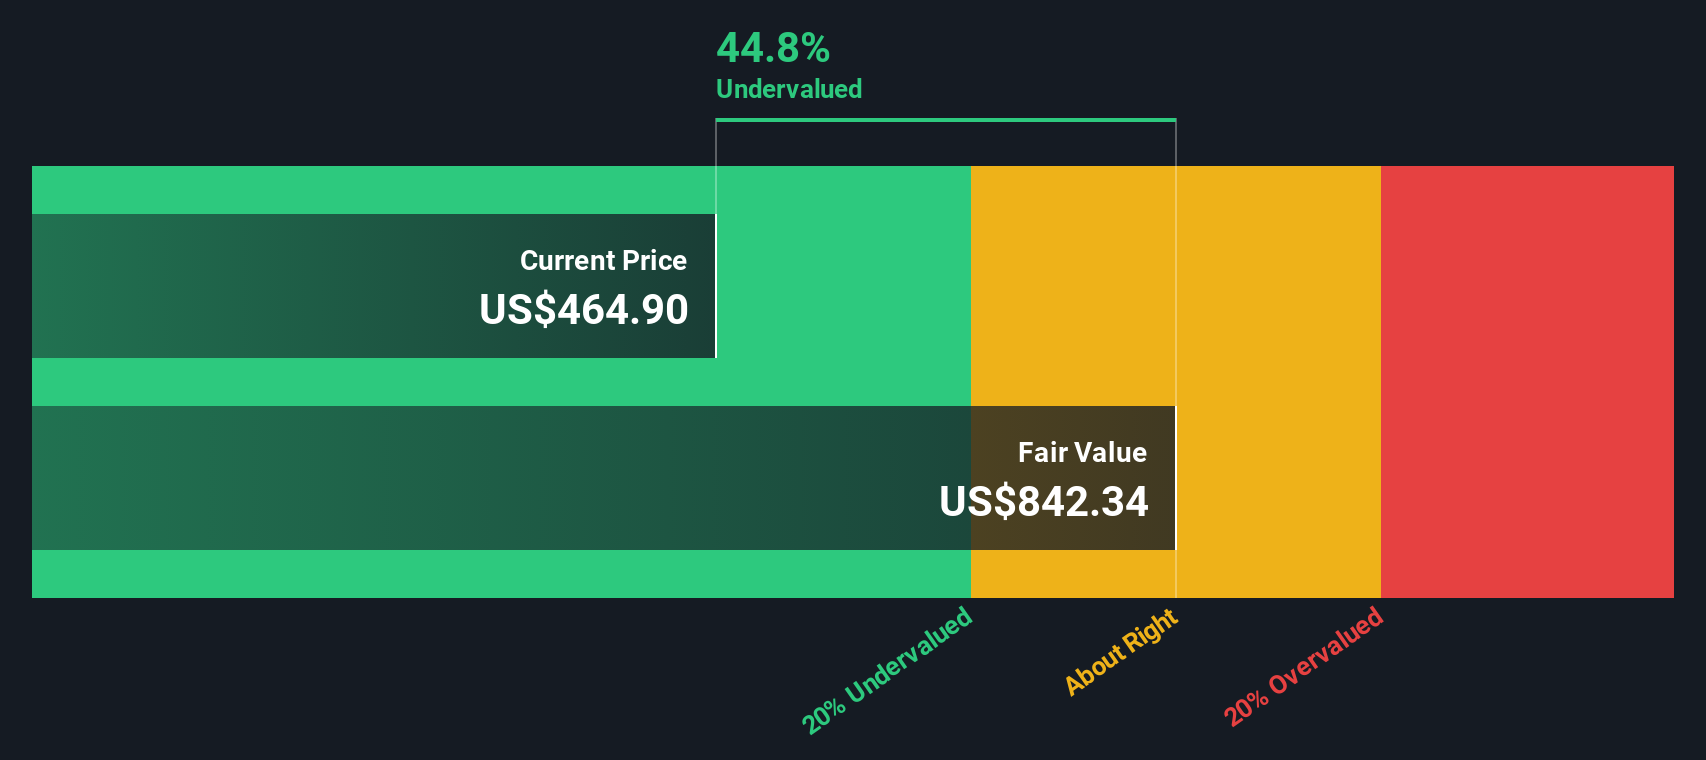
On this basis, the DCF model produces an estimated intrinsic value of about $860.33 per share. Compared with the recent share price of $359.27, this implies the stock is around 58.2% below that DCF estimate, which suggests it screens as undervalued under this specific set of assumptions.
Result: UNDERVALUED
Our Discounted Cash Flow (DCF) analysis suggests Alnylam Pharmaceuticals is undervalued by 58.2%. Track this in your watchlist or portfolio, or discover 863 more undervalued stocks based on cash flows.
Approach 2: Alnylam Pharmaceuticals Price vs Sales
For companies where earnings are not the main focus yet, the P/S ratio is often more useful than P/E, because it compares the share price to current revenue without relying on profit levels that can be small or volatile.
What investors feel is a fair P/S ratio usually reflects how they see the company’s growth prospects and risk. Higher expected growth and perceived resilience often justify a higher multiple, while greater uncertainty can point to a lower one.
Alnylam Pharmaceuticals currently trades on a P/S of 14.79x, compared with the Biotechs industry average of 12.07x and a peer group average of 8.58x. Simply Wall St’s Fair Ratio for Alnylam on this metric is 16.29x. This Fair Ratio is a proprietary estimate of what the P/S could be, given factors such as the company’s earnings growth profile, its industry, profit margins, market cap and key risks.
Because the Fair Ratio is tailored to the company, it can be more informative than a simple comparison to peers or the broad industry, which may have very different growth, profitability and risk characteristics. With a current P/S of 14.79x versus a Fair Ratio of 16.29x, the stock screens as slightly cheap on this measure.
Result: UNDERVALUED

P/S ratios tell one story, but what if the real opportunity lies elsewhere? Discover 1445 companies where insiders are betting big on explosive growth.
Upgrade Your Decision Making: Choose your Alnylam Pharmaceuticals Narrative
Earlier we mentioned that there is an even better way to understand valuation. On Simply Wall St’s Community page you can use Narratives, where you set out your story for Alnylam Pharmaceuticals, link it to specific forecasts for revenue, earnings and margins, arrive at a fair value, and then compare that fair value to the current price. The system updates your Narrative as new news or earnings are released. One investor might focus on a more optimistic Alnylam case built around the higher earnings and price targets in the US$583 range, while another might anchor on the lower US$236 view. Narratives helps you see clearly how those different stories translate into very different valuations and potential decisions on when to buy or sell.
Do you think there's more to the story for Alnylam Pharmaceuticals? Head over to our Community to see what others are saying!
This article by Simply Wall St is general in nature. We provide commentary based on historical data and analyst forecasts only using an unbiased methodology and our articles are not intended to be financial advice. It does not constitute a recommendation to buy or sell any stock, and does not take account of your objectives, or your financial situation. We aim to bring you long-term focused analysis driven by fundamental data. Note that our analysis may not factor in the latest price-sensitive company announcements or qualitative material. Simply Wall St has no position in any stocks mentioned.