Is It Time To Reassess American Airlines Group (AAL) After Its Recent Share Price Rebound
American Airlines Group Inc. AAL | 0.00 |
- If you are wondering whether American Airlines Group is starting to look attractively priced, or if the risks still outweigh the potential upside, this article breaks down what the current share price may be implying about value.
- The stock last closed at US$12.94, with recent returns of 14.4% over 7 days, 18.7% over 30 days, 22.5% over 1 year and a year-to-date return of a 16.4% decline, which gives mixed signals on how the market has been reassessing it over different time frames.
- Recent headlines have focused on American Airlines Group's ongoing position in the U.S. airline sector and investor attention around its share price moves, which helps explain the short-term swings in sentiment. These stories frame the context for understanding whether the current price is aligned with fundamentals or more driven by changing expectations.
- Simply Wall St currently assigns the stock a valuation score of 2 out of 6. The key question is how different valuation approaches judge the shares today, and whether a broader framework later in this article can give you a clearer view of value.
American Airlines Group scores just 2/6 on our valuation checks. See what other red flags we found in the full valuation breakdown.
Approach 1: American Airlines Group Discounted Cash Flow (DCF) Analysis
A Discounted Cash Flow, or DCF, model estimates what a stock could be worth today by projecting the company’s future cash flows and discounting them back to a present value. It is essentially asking what those future dollars are worth in today’s terms.
For American Airlines Group, the model used is a 2 Stage Free Cash Flow to Equity approach. The latest twelve month Free Cash Flow is reported at about $1.66b. Analysts provide explicit Free Cash Flow estimates for the next few years, and Simply Wall St then extrapolates these further out. Under this framework, projected Free Cash Flow for 2029 is $1.41b, with additional projections extending to 2035.
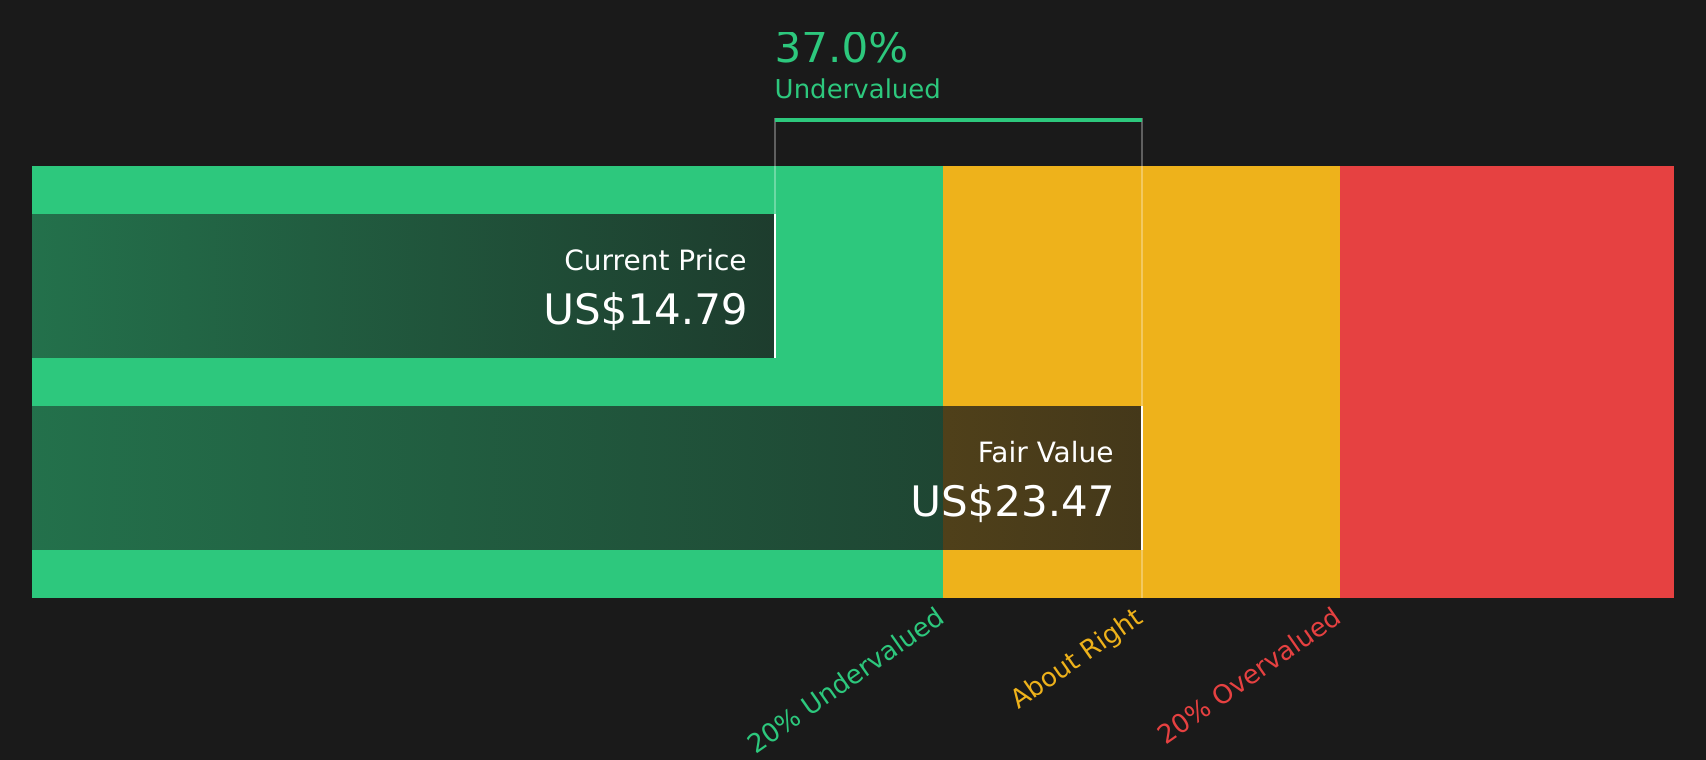
Putting those cash flow projections together, the DCF model arrives at an estimated intrinsic value of US$20.68 per share. Compared with the recent share price of US$12.94, this implies the stock is around 37.4% undervalued according to these assumptions.
Result: UNDERVALUED
Our Discounted Cash Flow (DCF) analysis suggests American Airlines Group is undervalued by 37.4%. Track this in your watchlist or portfolio, or discover 44 more high quality undervalued stocks.
Approach 2: American Airlines Group Price vs Earnings
For profitable companies, the P/E ratio is a straightforward way to relate what you are paying for the stock to the earnings it is currently generating. It helps you see how many dollars investors are willing to pay today for each dollar of earnings.
What counts as a “normal” P/E ratio often reflects how the market views a company’s growth potential and risk. Higher expected growth or lower perceived risk can support a higher P/E, while lower growth or higher risk usually line up with a lower P/E.
American Airlines Group currently trades on a P/E of 42.37x. That sits well above the Airlines industry average P/E of 8.74x and the peer group average of 25.57x. Simply Wall St also calculates a proprietary “Fair Ratio” for the stock of 37.96x, which aims to estimate what the P/E could be given factors such as earnings growth, profit margins, industry, market capitalization and risk profile.
Because the Fair Ratio brings all of those elements together, it can be a more tailored benchmark than a simple comparison with peers or the sector, which may differ on size, growth or risk. Set against this Fair Ratio, the current P/E of 42.37x is higher, which points to the stock trading on a richer multiple than that framework suggests.
Result: OVERVALUED

P/E ratios tell one story, but what if the real opportunity lies elsewhere? Start investing in legacies, not executives. Discover our 19 top founder-led companies.
Upgrade Your Decision Making: Choose your American Airlines Group Narrative
Earlier it was mentioned that there is an even better way to understand valuation. Narratives on Simply Wall St give you a simple story to attach to your numbers by linking what you believe about American Airlines Group’s business, future revenue, earnings and margins to a financial forecast, a Fair Value, and a clear buy or sell timing signal based on how that Fair Value compares with the current price. All of this is within an easy to use tool on the Community page that updates automatically when new news or earnings arrive. One investor might build a cautious Narrative that focuses on American’s negative equity, higher debt load and sensitivity to shocks and arrives at a Fair Value near the lower end of community estimates around US$10.00. Another might focus on premium economy initiatives, loyalty program economics and long term demand and land closer to the upper end near US$75.83, with both views visible side by side so you can decide which story and valuation better matches your own expectations.
For American Airlines Group, however, we'll make it really easy for you with previews of two leading American Airlines Group Narratives:
Both are built from the same core data, but they tell very different stories about risk, balance sheet strength and how much you might be willing to pay for the stock at today’s price.
Fair value in this narrative: US$14.94
Implied discount vs current price: about 13.4% undervalued
Assumed future revenue growth: 6.94% per year
- Sees domestic demand, premium seating and loyalty program expansion as key supports for revenue and margin improvement over time.
- Builds in revenue of US$66.8b and earnings of US$2.1b by 2029, with profit margins rising from 0.2% to 3.2% and a future P/E of 6.6x.
- Accepts higher fuel and labor costs and a large debt load as risks, but treats them as manageable within a 12.33% discount rate and a fair value near US$15.
Fair value in this narrative: US$10.61
Implied premium vs current price: about 22.0% overvalued
Assumed future revenue growth: 2.5% per year
- Focuses on American Airlines Group’s negative equity and high debt as core concerns, arguing that the balance sheet leaves little room for error.
- Emphasizes sensitivity to any drop in travel demand and tougher competition, which could put pressure on both revenue and margins.
- Views the stock as hard to justify unless economic conditions are very strong, which keeps this fair value meaningfully below the current share price.
Together, these Narratives give you a defined bullish and bearish reference point around today’s US$12.94 share price so you can decide which set of assumptions feels closer to your own view of the company’s risks and potential.
To see how these results tie into long-term growth, risks, and valuation, check out the full range of community narratives for American Airlines Group on Simply Wall St. Add the company to your watchlist or portfolio so you'll be alerted when the story evolves.
Do you think there's more to the story for American Airlines Group? Head over to our Community to see what others are saying!

This article by Simply Wall St is general in nature. We provide commentary based on historical data and analyst forecasts only using an unbiased methodology and our articles are not intended to be financial advice. It does not constitute a recommendation to buy or sell any stock, and does not take account of your objectives, or your financial situation. We aim to bring you long-term focused analysis driven by fundamental data. Note that our analysis may not factor in the latest price-sensitive company announcements or qualitative material. Simply Wall St has no position in any stocks mentioned.