Is It Time To Reassess Best Buy (BBY) After Its Mixed Share Price Performance?
Best Buy Co.,Inc. BBY | 64.50 | +0.30% |
- If you are looking at Best Buy and wondering whether the recent share price tells the full story about its value, you are not alone.
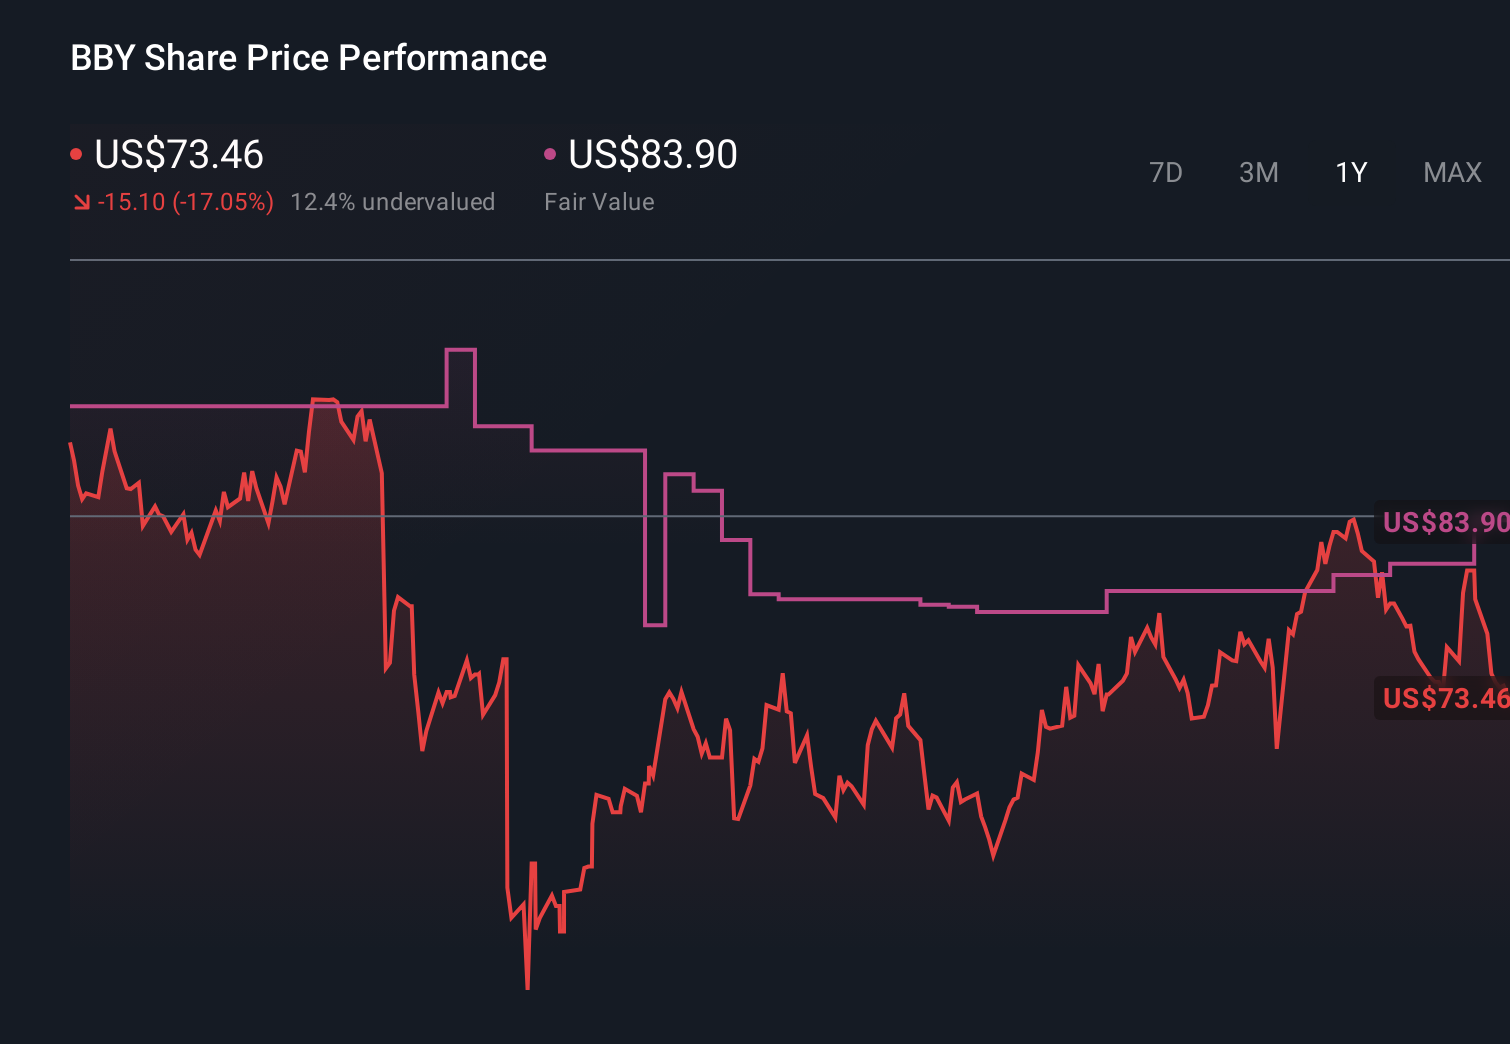
- The stock closed at US$68.04, with a 3.8% gain over the last 7 days, a 3.6% decline over 30 days, a 1.6% decline year to date, and an 18.5% decline over 1 year. The 3 year and 5 year returns sit at 11.0% and 30.2% declines respectively.
- These mixed returns have kept investors focused on how the market is reacting to ongoing shifts in consumer electronics demand and store traffic, along with broader questions about retail resilience. Recent news flow around big box retailers and consumer spending trends has added context to these moves, as investors weigh how much of this sentiment is already reflected in Best Buy's share price.
- On Simply Wall St's valuation checks, Best Buy scores 3 out of 6 for being undervalued, giving it a valuation score of 3. Next we will walk through the main valuation methods behind that score, before finishing with a different way to think about what the market might be missing.
Approach 1: Best Buy Discounted Cash Flow (DCF) Analysis
A DCF model estimates what a company might be worth by projecting its future cash flows and then discounting those back to today using a required rate of return. It is essentially asking what all those future cash flows are worth in present dollar terms.
For Best Buy, Simply Wall St uses a 2 Stage Free Cash Flow to Equity model built on cash flow projections. The latest twelve month Free Cash Flow is about $1.48b. Analyst and model projections suggest Free Cash Flow of $1.24b in 2026 and $1.99b in 2030, with later years extrapolated by Simply Wall St rather than based on direct analyst estimates.
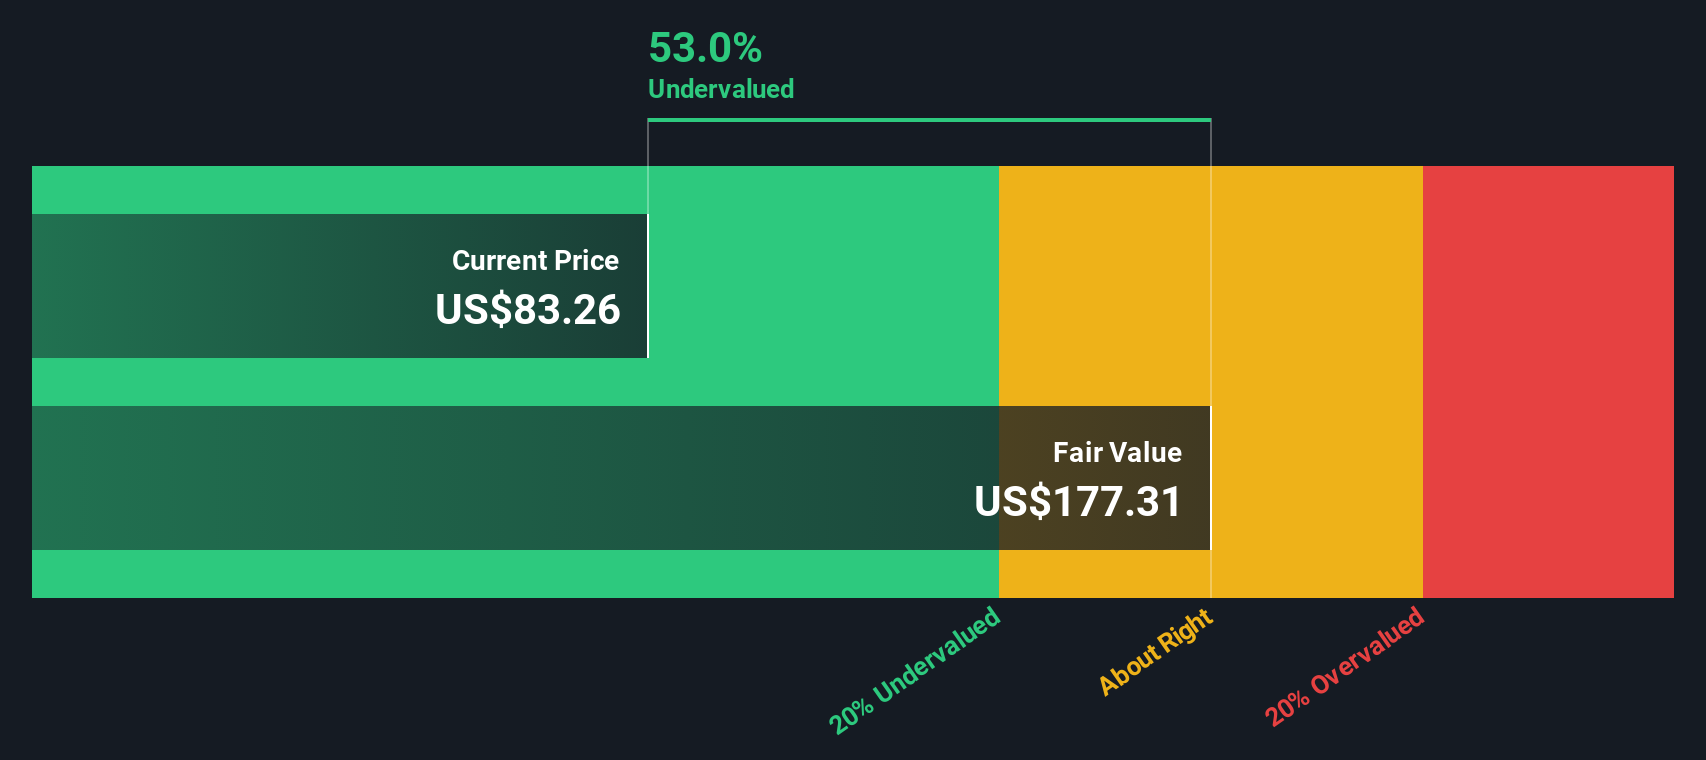
After discounting ten years of projected Free Cash Flow and a terminal value, the model arrives at an estimated intrinsic value of about $151.23 per share. Compared with the recent share price of US$68.04, this implies the stock is about 55.0% undervalued according to this particular DCF setup.
Result: UNDERVALUED
Our Discounted Cash Flow (DCF) analysis suggests Best Buy is undervalued by 55.0%. Track this in your watchlist or portfolio, or discover 51 more high quality undervalued stocks.
Approach 2: Best Buy Price vs Earnings
For a profitable retailer like Best Buy, the P/E ratio is a useful shorthand for how much investors are paying for each dollar of earnings. It ties the share price directly to current profitability, which is central for businesses that consistently generate earnings rather than relying mainly on assets or revenue growth.
What counts as a reasonable P/E usually reflects how the market sees a company’s growth potential and risk. Higher expected growth or lower perceived risk can support a higher multiple, while slower growth or higher risk tends to line up with a lower one.
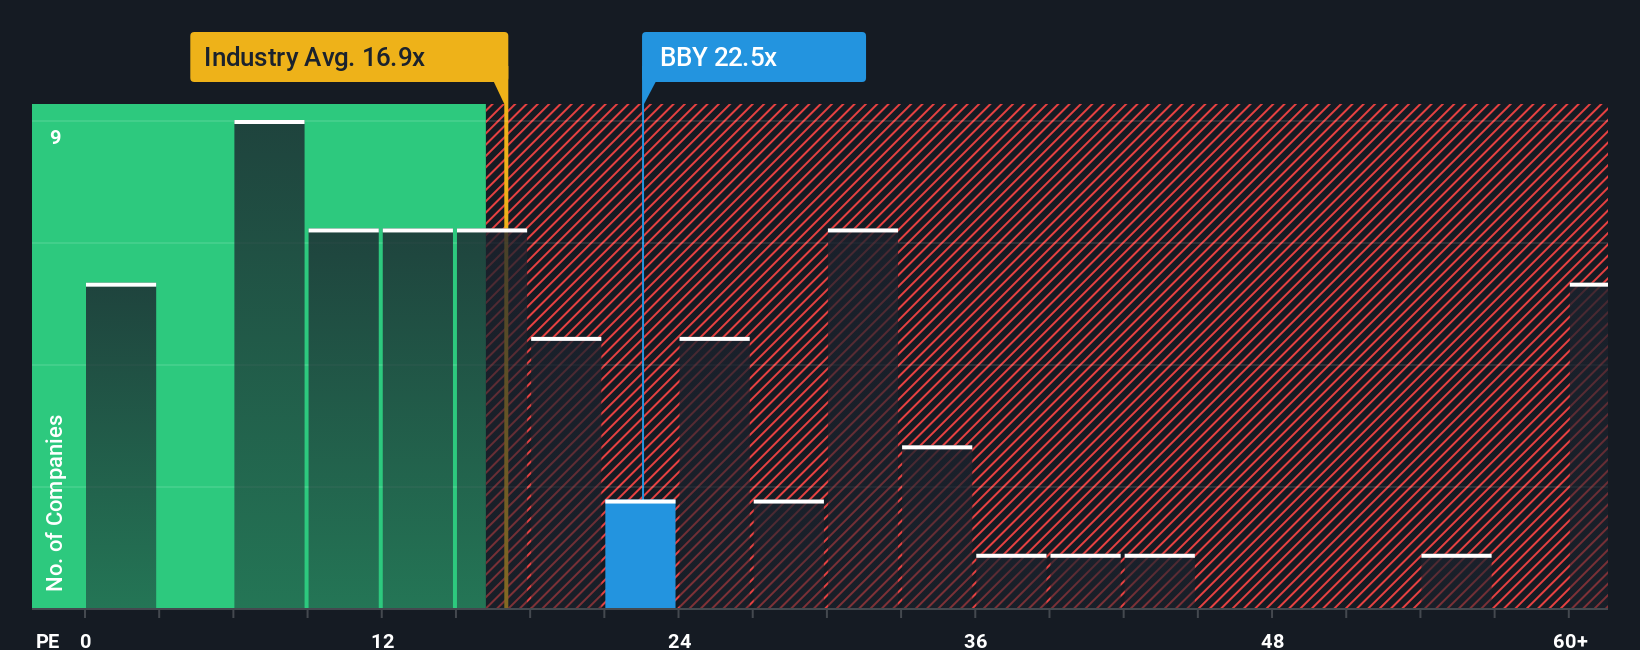
Best Buy currently trades on a P/E of 22.10x. That sits close to the Specialty Retail industry average of 20.42x and the peer average of 20.73x. Simply Wall St also estimates a Fair Ratio of 23.25x, which is the P/E level it might trade on given factors such as earnings growth, margins, industry, market cap and specific risks. This Fair Ratio can be more tailored than a simple peer or industry comparison because it blends these company specific inputs into a single benchmark. With the current 22.10x P/E slightly below the 23.25x Fair Ratio, the shares screen as mildly undervalued on this metric.
Result: UNDERVALUED
P/E ratios tell one story, but what if the real opportunity lies elsewhere? Start investing in legacies, not executives. Discover our 23 top founder-led companies.
Upgrade Your Decision Making: Choose your Best Buy Narrative
Earlier we mentioned that there is an even better way to understand valuation. On Simply Wall St you can use Narratives, where you write a short story about Best Buy, link that story to your own assumptions for revenue, earnings and margins, and the platform turns it into a financial forecast, a fair value, and an easy comparison with the current share price, all kept up to date as new news or earnings land.
On the Community page you can see this in action today, with one Best Buy Narrative setting a fair value near US$63.68 based on more cautious views about tariffs, demand and margins. Another pins fair value closer to US$96.00 using more upbeat assumptions for revenue growth, profitability and future P/E. This shows how two investors can look at the same company, plug in different but clearly stated expectations, and reach very different conclusions about whether the current price looks attractive or not.
For Best Buy however we'll make it really easy for you with previews of two leading Best Buy Narratives:
Fair value: US$84.19 per share
Implied discount to this fair value: about 19.2% compared to the recent US$68.04 share price
Revenue growth assumption: 2%
- Sees Best Buy as a large but easily substitutable North American electronics retailer, with thin margins and high competition but still meaningful brand reach and services like Geek Squad.
- Highlights the shift toward omnichannel retail, using store closures, smaller formats, and heavy use of click and collect as ways to manage costs while keeping customer contact points.
- Applies modest assumptions, including a 3.6% net margin, 2% revenue growth, and an 8% discount rate, and concludes the shares look slightly undervalued based on blended DDM, DCF, and multiples work.
Fair value: about US$63.68 per share
Implied premium to this fair value: about 6.8% compared to the recent US$68.04 share price
Revenue growth assumption: about 0.86%
- Focuses on headwinds from tariffs, inflation, and weak product categories that could weigh on revenue, margins, and the pay off from newer profit initiatives such as Marketplace and Best Buy Ads.
- Builds in cautious expectations, with slightly declining revenue, profit margins rising toward about 3.5%, and a future P/E near 11x, discounted at around 9.1%.
- Anchors to a fair value near US$63.68, which reflects the lower end of analyst targets and assumes the market may be pricing in more optimism than these inputs justify.
Taken together, these two narratives show how different but clearly stated assumptions on growth, margins, and valuation multiples can lead to fair values that sit on either side of the current price. This gives you a structured way to test your own view on Best Buy.
Do you think there's more to the story for Best Buy? Head over to our Community to see what others are saying!
This article by Simply Wall St is general in nature. We provide commentary based on historical data and analyst forecasts only using an unbiased methodology and our articles are not intended to be financial advice. It does not constitute a recommendation to buy or sell any stock, and does not take account of your objectives, or your financial situation. We aim to bring you long-term focused analysis driven by fundamental data. Note that our analysis may not factor in the latest price-sensitive company announcements or qualitative material. Simply Wall St has no position in any stocks mentioned.