Is It Time To Reassess BILL Holdings (BILL) After The Recent 30% Price Jump
BILL Holdings BILL | 38.63 | +0.49% |
- If you are wondering whether BILL Holdings is attractively priced or still carrying a premium, this article will walk through what the numbers actually say about its current valuation.
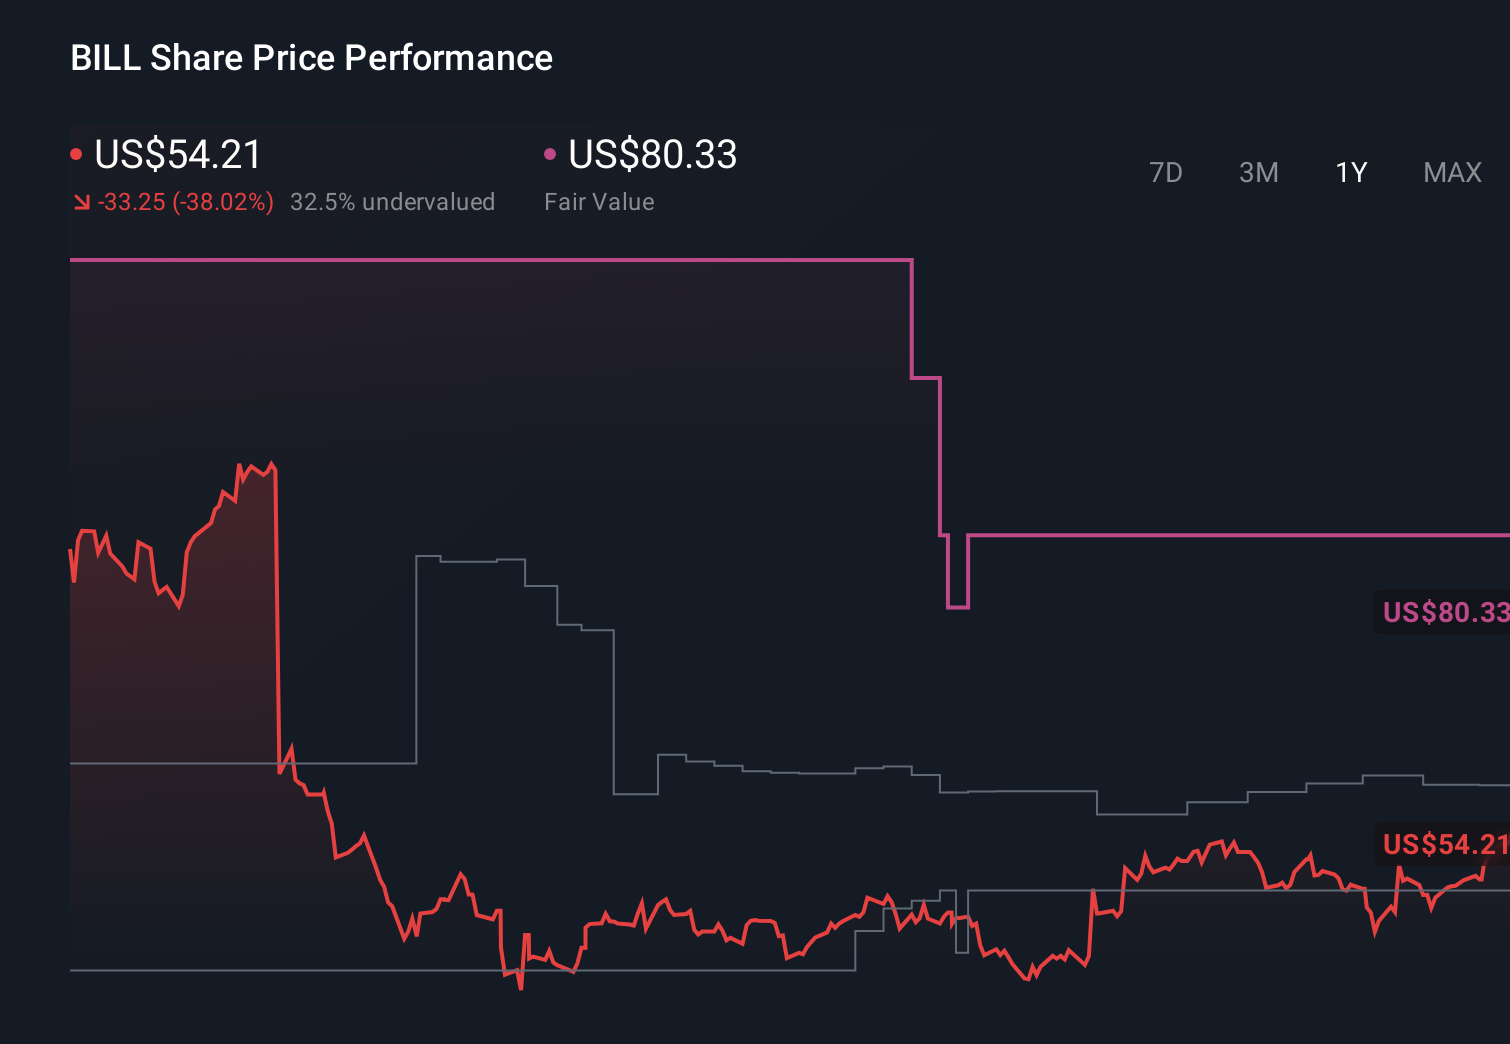
- The shares last closed at US$46.37, after a 30% gain over the past 7 days, set against declines of 9.5% over 30 days, 8.3% year to date and 23.8%, 52.0% and 74.2% over the past 1, 3 and 5 years respectively.
- Recent coverage of BILL Holdings has focused on its role in software for automating financial workflows for small and medium sized businesses and how sentiment around that niche has shifted over time. This mix of attention and changing expectations helps frame the sharp short term move in the share price alongside the weaker multi year returns.
- On Simply Wall St's 6 point valuation checklist, BILL Holdings scores a 5, reflecting assessments that it screens as undervalued on most, but not all, measures. Next we will compare different valuation approaches and then finish by looking at an even broader way to think about what the stock is really worth.
Approach 1: BILL Holdings Discounted Cash Flow (DCF) Analysis
A Discounted Cash Flow model estimates what a business might be worth by projecting its future cash flows and then discounting those projected amounts back to today using a required return. It focuses on cash the company could generate for shareholders rather than accounting earnings.
For BILL Holdings, the model starts with last twelve months free cash flow of about $344.9 million. Simply Wall St then uses a mix of analyst inputs and its own extrapolations to extend those cash flows out over the next decade. By 2035, the projection reaches around $1.24b of free cash flow, still expressed in today's dollars after discounting.
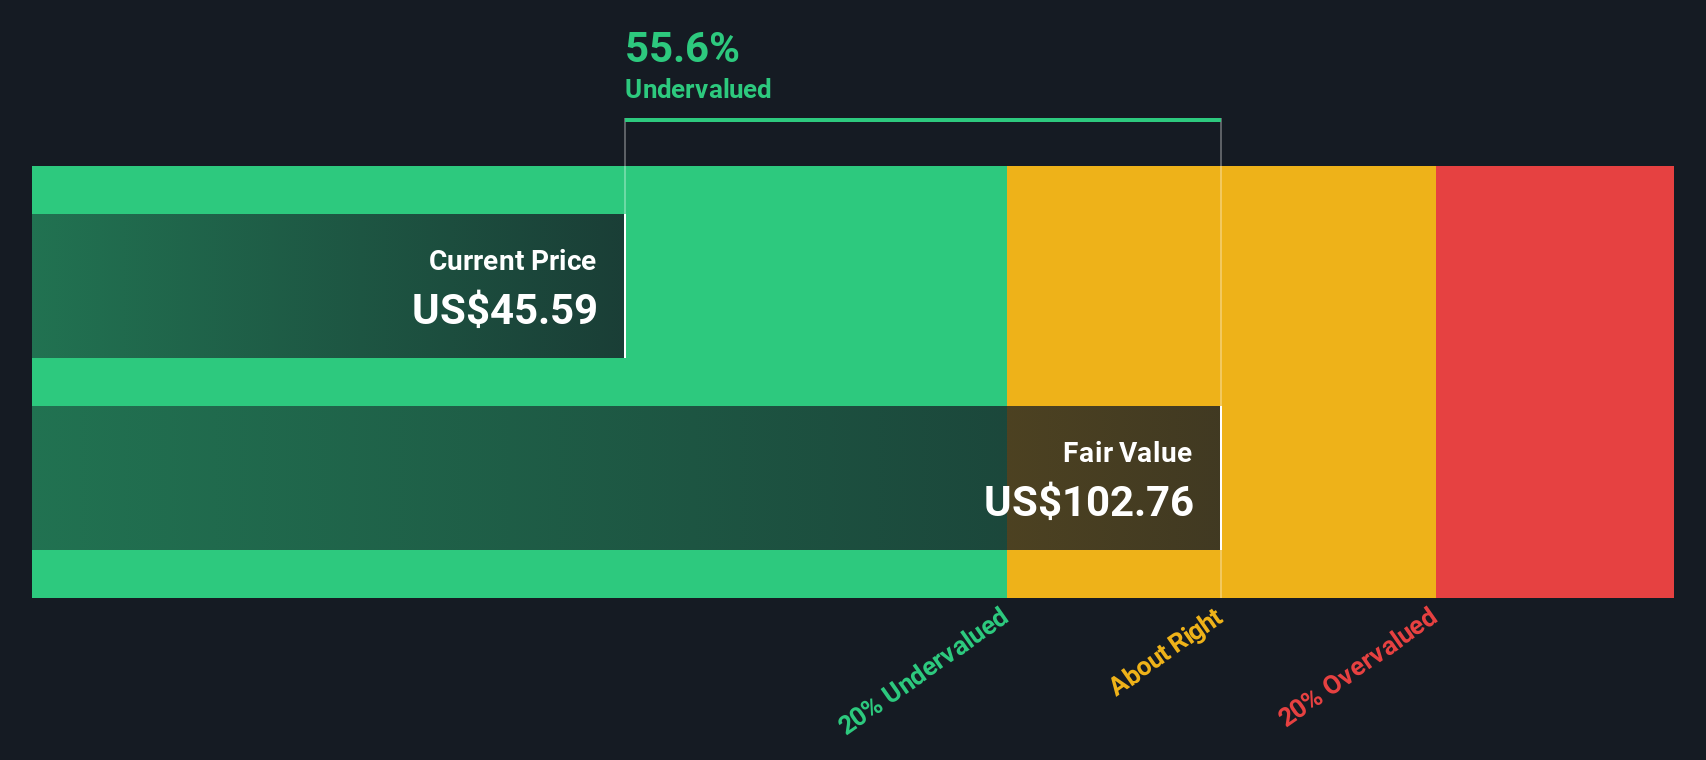
Using a 2 Stage Free Cash Flow to Equity model, these discounted cash flows imply an estimated intrinsic value of about $130.73 per share. Compared with the recent share price of $46.37, the DCF suggests the stock trades at roughly a 64.5% discount to this estimate, which screens as materially undervalued on this approach.
Result: UNDERVALUED
Our Discounted Cash Flow (DCF) analysis suggests BILL Holdings is undervalued by 64.5%. Track this in your watchlist or portfolio, or discover 55 more high quality undervalued stocks.
Approach 2: BILL Holdings Price vs Sales
For a business like BILL Holdings where investors often focus on revenue more than accounting earnings, the P/S ratio is a useful way to gauge what the market is paying for each dollar of sales. Growth expectations and risk both influence what counts as a normal or fair multiple, since faster, less uncertain revenue streams usually justify a higher P/S than slower or more volatile ones.
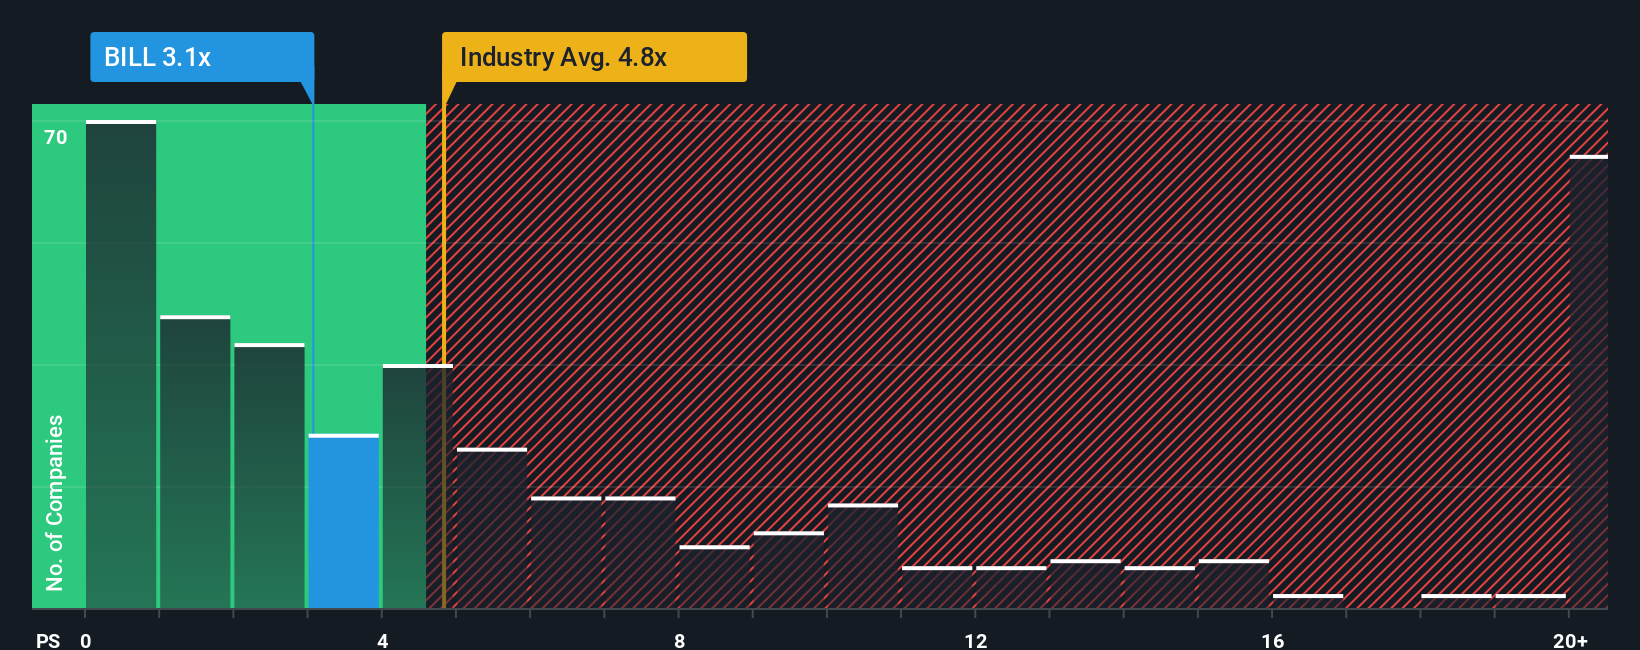
BILL Holdings is currently trading on a P/S of about 3x. That sits below the Software industry average of roughly 3.52x and also below the peer group average of about 4.51x. Simply Wall St then goes a step further with its proprietary Fair Ratio of 6.18x, which estimates the P/S you might expect after considering factors such as earnings growth, profit margins, company size, industry and specific risks.
This Fair Ratio can be more informative than a simple comparison to peers or the broad industry because it adjusts for BILL Holdings' own characteristics rather than assuming all software names deserve the same multiple. Set against the current 3x P/S, the 6.18x Fair Ratio indicates that, on this approach, the shares appear to be undervalued.
Result: UNDERVALUED
P/S ratios tell one story, but what if the real opportunity lies elsewhere? Start investing in legacies, not executives. Discover our 23 top founder-led companies.
Upgrade Your Decision Making: Choose your BILL Holdings Narrative
Earlier we mentioned that there is an even better way to understand valuation. On Simply Wall St's Community page you can use Narratives, where you and other investors connect a clear story about BILL Holdings to specific forecasts for revenue, earnings and margins. These then roll up into a Fair Value that is compared with the current share price and automatically refreshed as new news or earnings arrive. You might see one Narrative arguing for a higher Fair Value near US$89 based on stronger growth and margins, while another leans toward US$42 on more cautious assumptions, and you can decide which story best fits your own view.
For BILL Holdings however we will make it really easy for you with previews of two leading BILL Holdings Narratives:
Fair value: US$79.75 per share
Implied discount to fair value versus the last close of US$46.37: about 41.9% undervalued
Assumed annual revenue growth used in this narrative: 18.79%
- Analysts in this camp see AI enabled workflow tools, embedded partnerships and international expansion supporting a higher subscription mix and long run margins than current assumptions.
- The bullish case uses revenue reaching around US$2.4b and earnings of about US$207.7m by 2028, with BILL trading on a P/E of 49.0x at that point, and an updated fair value estimate of roughly US$79.75 per share.
- Risks they flag include slower core growth from tighter small business spending, execution challenges around new AI features and partnerships, and pressure on take rates and margins if pricing or regulation bite harder.
Fair value: US$43.75 per share
Implied premium to fair value versus the last close of US$46.37: about 6.0% overvalued
Assumed annual revenue growth used in this narrative: 11.55%
- The cautious view sees AI and automation making it harder for BILL to stand out, with competition, regulation and macro pressures all weighing on pricing power, margins and long term growth.
- This group uses revenue of about US$2.0b by 2028 and earnings of roughly US$261.5m, paired with a lower future P/E of 20.3x, to arrive at a fair value in the low US$40s per share.
- They acknowledge that strong product momentum, high retention, growing multiproduct adoption and a solid balance sheet could all challenge this stance if they support better than expected growth and profitability.
Putting it all together, the DCF work, the market multiples and these two narratives outline a clear spread of outcomes, ranging from a modest premium to recent trading through to a sizeable potential discount. The key question for you is which set of revenue, margin and P/E assumptions feels more realistic for how you think BILL's business will develop over the next few years, and how comfortable you are with the execution and competitive risks on either side of that range.
Do you think there's more to the story for BILL Holdings? Head over to our Community to see what others are saying!
This article by Simply Wall St is general in nature. We provide commentary based on historical data and analyst forecasts only using an unbiased methodology and our articles are not intended to be financial advice. It does not constitute a recommendation to buy or sell any stock, and does not take account of your objectives, or your financial situation. We aim to bring you long-term focused analysis driven by fundamental data. Note that our analysis may not factor in the latest price-sensitive company announcements or qualitative material. Simply Wall St has no position in any stocks mentioned.