Is It Time To Reassess Carvana (CVNA) After Sharp Swings In Share Price?
Carvana Co. Class A CVNA | 320.22 332.67 | +1.06% +3.89% Post |
- If you are wondering whether Carvana's current share price really reflects its business prospects, you are not alone. This article will walk through how the stock stacks up on value.
- At a last close of US$325.16, the stock has seen a 7.3% decline over the past week, a 31.3% decline over the past month, an 18.8% decline year to date, a 46.7% gain over the past year, and a very large return over three years.
- Recent coverage has focused on Carvana's share price swings and what they may imply for risk appetite in used car retail. Several commentators have highlighted how quickly sentiment can shift for companies that have already delivered very large multi year returns. This backdrop helps frame the question of whether current pricing leans more toward optimism or caution.
- On Simply Wall St's valuation checks, Carvana records a score of 3 out of 6, which suggests some metrics flag it as undervalued while others do not. Next, we will compare common valuation approaches before finishing with a framework that can help you judge whether those numbers truly fit your own view of the stock.
Approach 1: Carvana Discounted Cash Flow (DCF) Analysis
A Discounted Cash Flow, or DCF, model estimates what a company might be worth by projecting its future cash flows and discounting them back to today using a required rate of return. It translates a stream of future dollars into a single present value number.
For Carvana, the model used is a 2 Stage Free Cash Flow to Equity approach, based on cash flows available to shareholders. The latest twelve month free cash flow is given as $888.46 million. Analyst based projections extend out to 2030, with Simply Wall St extrapolating further years. Within that path, the model includes a projected free cash flow of $4.26b in 2030, expressed in today's money through discounting.
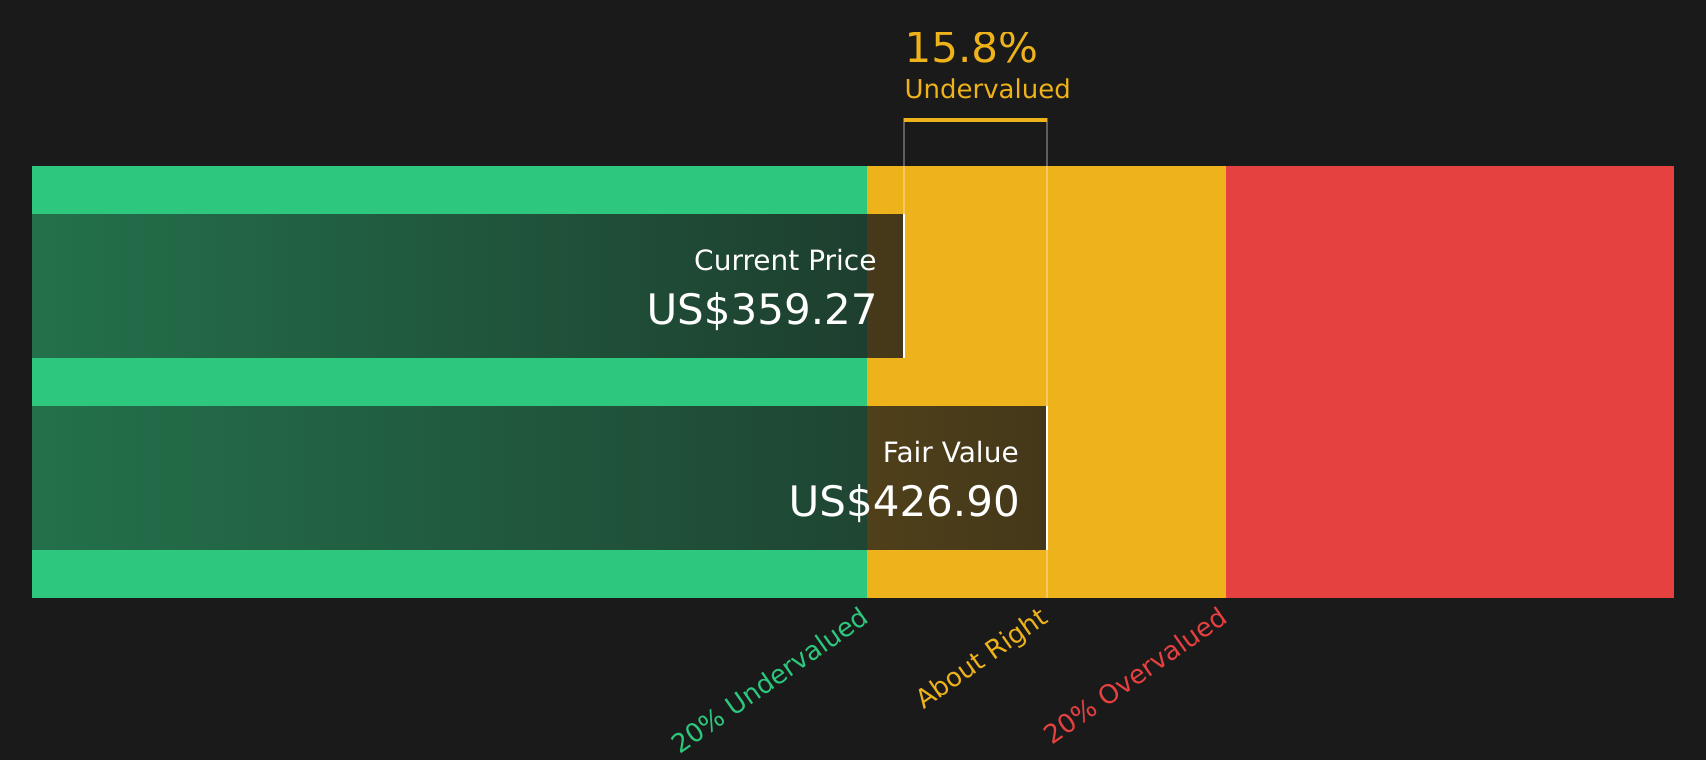
Putting all those yearly cash flows together, the DCF output suggests an estimated intrinsic value of about $426.59 per share. Compared with the recent share price of $325.16, this indicates Carvana is trading at roughly a 23.8% discount to that intrinsic estimate, based on this model.
Result: UNDERVALUED
Our Discounted Cash Flow (DCF) analysis suggests Carvana is undervalued by 23.8%. Track this in your watchlist or portfolio, or discover 51 more high quality undervalued stocks.
Approach 2: Carvana Price vs Earnings
For profitable companies, the P/E ratio is a useful shorthand because it links what you pay for each share directly to the earnings that support that share. It gives you a simple way to compare how the market is pricing one dollar of earnings across different businesses.
What counts as a normal or fair P/E depends heavily on how much growth investors expect and how much risk they see. Higher expected earnings growth or lower perceived risk can justify a higher P/E, while slower growth or higher risk usually lines up with a lower P/E.
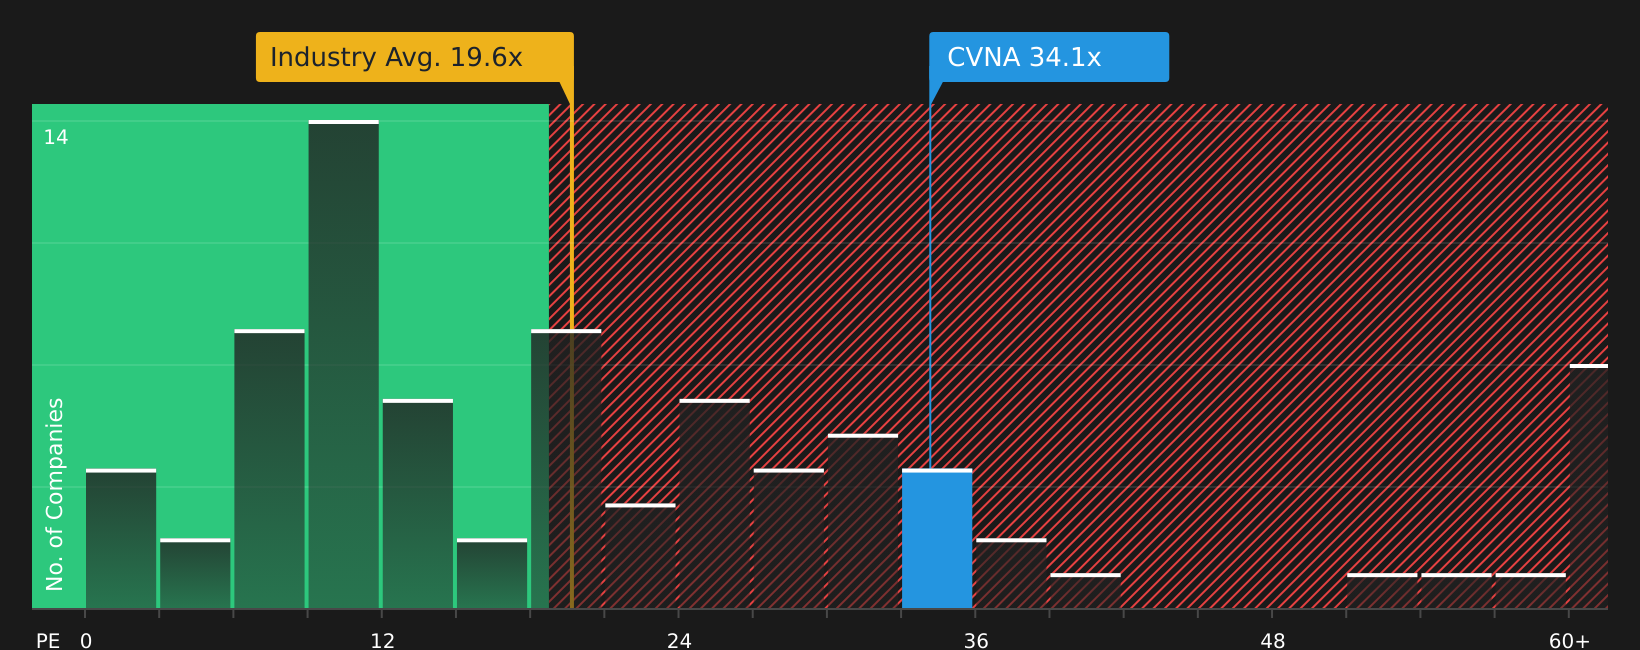
Carvana currently trades on a P/E of 33.0x. That sits above the Specialty Retail industry average of about 21.0x and also above the peer average of 19.1x, so on simple comparisons the stock carries a richer earnings multiple.
Simply Wall St also calculates a proprietary “Fair Ratio” for Carvana of 32.4x. This is an estimate of the P/E you might expect after considering factors such as earnings growth, profit margins, industry, market cap and company specific risks. Because it is tailored to the company, it can be more informative than relying only on broad industry or peer averages.
Compared with this Fair Ratio, Carvana’s current P/E of 33.0x is slightly higher, which indicates that the shares may be marginally overvalued on this metric.
Result: OVERVALUED
P/E ratios tell one story, but what if the real opportunity lies elsewhere? Start investing in legacies, not executives. Discover our 22 top founder-led companies.
Upgrade Your Decision Making: Choose your Carvana Narrative
Earlier we mentioned that there is an even better way to understand valuation. Let us introduce you to Narratives, a simple tool on Simply Wall St’s Community page that lets you attach your own story about Carvana to specific assumptions for future revenue, earnings and margins, link those assumptions to a fair value, and then compare that fair value with the current share price. It updates automatically when new information such as earnings or short seller reports arrives. You can see, for example, how one Carvana Narrative might justify a fair value close to US$307.90 using more cautious margin and growth assumptions, while another points to US$600 on more optimistic views. This can help you decide which story, and price, feels closer to your own view of the stock.
For Carvana, however, we will make it really easy for you with previews of two leading Carvana Narratives:
Here is how a bullish and a bearish story line up side by side so you can see which assumptions feel closer to your own view.
Fair value in this bullish narrative: US$600.00
Implied discount to this fair value at US$325.16: about 45.8% undervalued
Revenue growth assumption used in this story: 30.78% per year
- Assumes Carvana scales a nationwide, tech heavy reconditioning and logistics network that supports higher volumes, stronger margins and operating leverage.
- Builds in continued growth in fully online car buying and higher attachment of financing and other services, lifting long term customer value and profitability.
- Takes analyst bullish targets around US$500 to US$600 as a reference point, with sizable revenue, earnings and margin expansion by 2028 and a future P/E above the current Specialty Retail average.
Fair value in this cautious narrative: US$79.77
Implied premium to this fair value at US$325.16: about 307.4% overvalued
Revenue growth assumption used in this story: 7.42% decline
- Frames Carvana as a stock that has run well ahead of its business fundamentals, with the equity price described as several times higher than an intrinsic value floor.
- Highlights concerns around leverage, short seller allegations and sensitivity to earnings events, with the view that recent returns have been driven heavily by momentum and sentiment.
- Points to high volatility and elevated expectations, suggesting that investors are effectively assuming a much larger future market share and sustained premium pricing on the stock.
These two narratives use the same company, the same share price and the same set of public data, yet they arrive at very different fair values. Your task is to decide which story, or what mix of the two, lines up with your own expectations for Carvana's growth, margins and risk.
If you want to see how other investors are framing the trade offs, and how their assumptions translate into numbers, Curious how numbers become stories that shape markets? Explore Community Narratives.
Do you think there's more to the story for Carvana? Head over to our Community to see what others are saying!

This article by Simply Wall St is general in nature. We provide commentary based on historical data and analyst forecasts only using an unbiased methodology and our articles are not intended to be financial advice. It does not constitute a recommendation to buy or sell any stock, and does not take account of your objectives, or your financial situation. We aim to bring you long-term focused analysis driven by fundamental data. Note that our analysis may not factor in the latest price-sensitive company announcements or qualitative material. Simply Wall St has no position in any stocks mentioned.