Is It Time To Reassess DexCom (DXCM) After Recent Glucose Monitoring Headlines?
DexCom, Inc. DXCM | 0.00 |
- If you are wondering whether DexCom at around US$72.86 is a bargain or a stock to be cautious about, the next step is to look closely at what that price might already be pricing in.
- The stock has risen 20.7% over the past month and is up 9.5% year to date, even though it is down 1.2% over the past week and has declined 15.9% over the last year and 41.4% over three years.
- Recent headlines around glucose monitoring, reimbursement policies and competition in medical devices help explain why DexCom has seen both renewed interest and ongoing caution in its share price. These themes shape how investors think about future demand for its products and the risks around that demand.
- DexCom currently scores 2 out of 6 on Simply Wall St's valuation checks, so the next step is a closer look at standard valuation tools like DCFs and multiples, followed by a framework that can help you put all those methods in a clearer context.
DexCom scores just 2/6 on our valuation checks. See what other red flags we found in the full valuation breakdown.
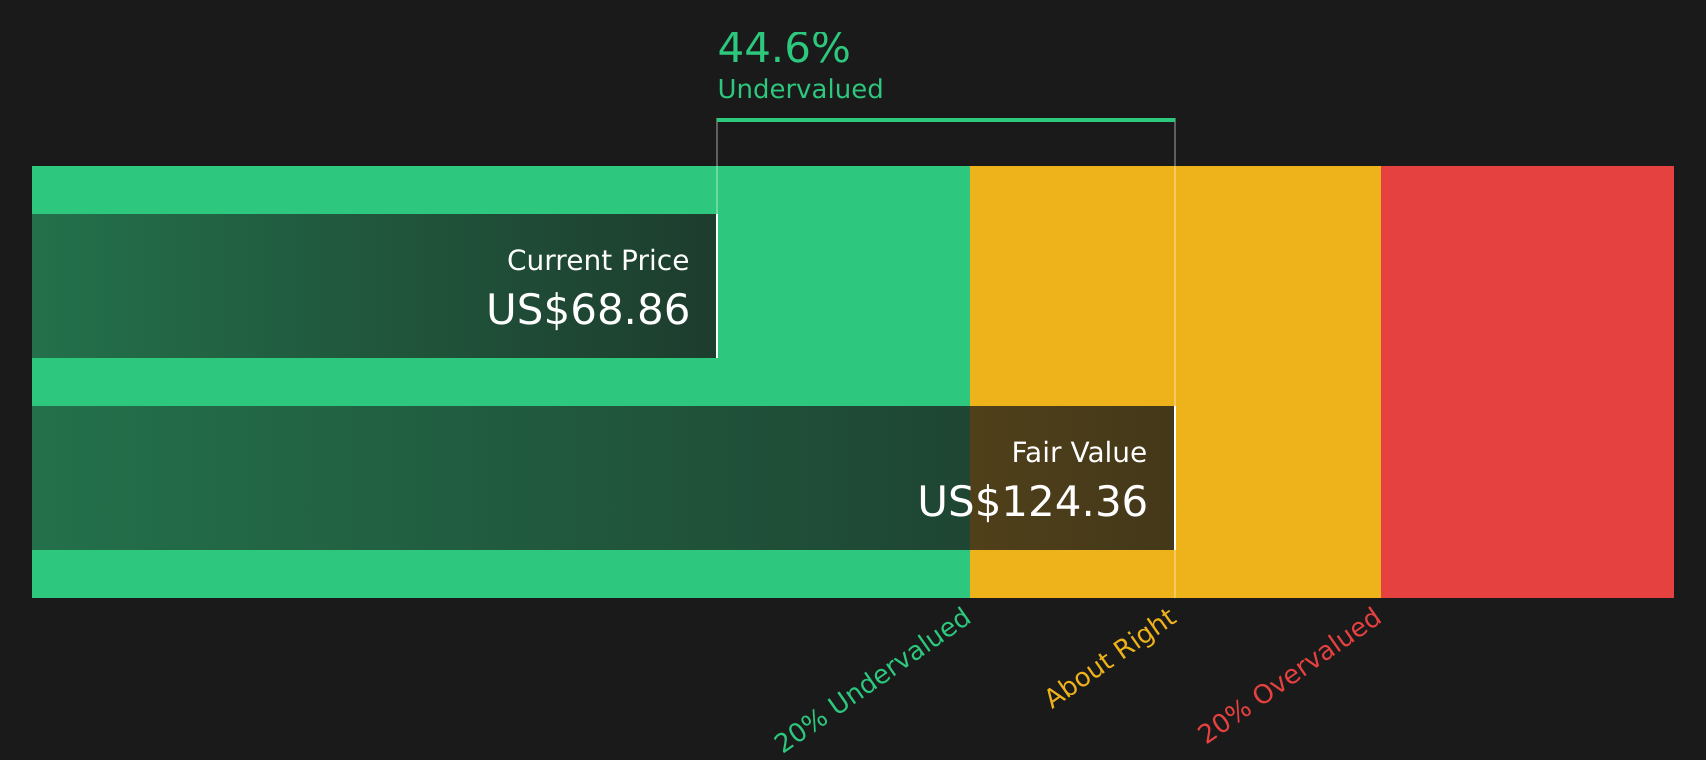
Approach 1: DexCom Discounted Cash Flow (DCF) Analysis
A Discounted Cash Flow, or DCF, model takes the cash DexCom is expected to generate in the future, then discounts those projected cash flows back into today’s dollars to estimate what the stock might be worth now.
DexCom’s last twelve month Free Cash Flow is about $1.42b. Using analyst forecasts and Simply Wall St extrapolations, Free Cash Flow is projected to reach about $1.94b by 2030, with a series of annual projections from 2026 to 2035 all converted into today’s value using a 2 Stage Free Cash Flow to Equity approach.
On this basis, the DCF model points to an estimated intrinsic value of about $117.01 per share. Against a recent share price of roughly $72.86, that implies DexCom trades at a discount of about 37.7%. For the purposes of this model, that is treated as meaning the stock screens as undervalued on this specific cash flow model.
Result: UNDERVALUED
Our Discounted Cash Flow (DCF) analysis suggests DexCom is undervalued by 37.7%. Track this in your watchlist or portfolio, or discover 49 more high quality undervalued stocks.
Approach 2: DexCom Price vs Earnings
For profitable companies, the P/E ratio is a useful way to see how much you are paying for each dollar of current earnings, which makes it a common yardstick for comparing stocks in the same sector.
Growth expectations and risk both influence what looks like a “normal” or “fair” P/E. Higher expected growth or lower perceived risk can support a higher multiple, while slower growth or higher risk usually points to a lower, more conservative P/E.
DexCom currently trades on a P/E of 30.22x. That sits above the Medical Equipment industry average of 25.29x and the peer group average of 21.46x. Simply Wall St’s Fair Ratio for DexCom is 29.65x, which reflects the P/E that might be expected once factors such as earnings growth, profit margins, industry, market cap and company specific risks are all considered together.
This Fair Ratio is more tailored than a simple comparison with industry or peers, because it adjusts for differences in growth, risk and profitability rather than assuming every company deserves the same multiple. With DexCom’s current P/E only slightly above the Fair Ratio, the stock screens as close to fairly valued on this metric.
Result: ABOUT RIGHT

P/E ratios tell one story, but what if the real opportunity lies elsewhere? Start investing in legacies, not executives. Discover our 21 top founder-led companies.
Upgrade Your Decision Making: Choose your DexCom Narrative
Earlier it was mentioned that there is an even better way to understand valuation. This is where Narratives come in as your way to attach a clear story about DexCom to the numbers you are seeing on Simply Wall St, linking your view of its future revenue, earnings and margins to a financial forecast, a Fair Value, and then a comparison with the current price.
On the Community page, Narratives are set up as easy to use tools that many investors rely on. They update automatically when fresh information such as earnings or news is added, so your story about DexCom and the Fair Value that falls out of that story can stay aligned with what is happening in the real world.
For DexCom, one investor might lean toward a more optimistic Narrative that lines up with a Fair Value of about US$112.00. Another might choose a more cautious Narrative closer to US$64.00 or US$65.00. By comparing either of those Fair Values to the current share price, you can quickly decide whether it looks like a potential buying opportunity to you, a possible candidate to trim, or a stock to simply keep watching.
For DexCom, however, we will make it really easy for you with previews of two leading DexCom Narratives:
Fair Value: US$81.64
Current price vs this Fair Value: about 10.8% below
Analyst revenue growth assumption: 11.66% a year
- Expanded reimbursement for type 2 diabetes and broader international coverage increase the pool of potential DexCom users and support a larger global revenue base.
- Product progress in CGM hardware, software and AI features, alongside digital integrations and manufacturing efficiencies, is expected to support margins, recurring revenue and free cash flow.
- Key watchpoints include possible pricing pressure from CMS bidding, tougher competition, supply chain pressures and leadership transition risk as a new CEO takes over in 2026.
Fair Value: US$65.00
Current price vs this Fair Value: about 12.1% above
Bearish revenue growth assumption: 9.79% a year
- Slower than hoped adoption of CGM among newly covered type 2 patients, along with uncertainty around future Medicare coverage terms, could limit revenue and earnings compared with bullish expectations.
- Input cost pressures, such as higher resin and fuel costs, and the effort required to embed AI driven apps and tools into everyday patient use, may restrain margin expansion.
- This view leans on a lower Fair Value of US$65.00 that uses more conservative growth, margin and P/E assumptions than consensus, while still acknowledging upside if coverage, product uptake or international growth outpace these cautious expectations.
If you want to see how these two viewpoints are built from the ground up, you can read them in full and then decide which one lines up more closely with your own expectations about DexCom and its stock.
To see how these results tie into long-term growth, risks, and valuation, check out the full range of community narratives for DexCom on Simply Wall St. Add the company to your watchlist or portfolio so you'll be alerted when the story evolves.
Do you think there's more to the story for DexCom? Head over to our Community to see what others are saying!

This article by Simply Wall St is general in nature. We provide commentary based on historical data and analyst forecasts only using an unbiased methodology and our articles are not intended to be financial advice. It does not constitute a recommendation to buy or sell any stock, and does not take account of your objectives, or your financial situation. We aim to bring you long-term focused analysis driven by fundamental data. Note that our analysis may not factor in the latest price-sensitive company announcements or qualitative material. Simply Wall St has no position in any stocks mentioned.