Is It Time To Reassess EastGroup Properties (EGP) After Strong Multi Year Share Price Gains
EastGroup Properties, Inc. EGP | 0.00 |
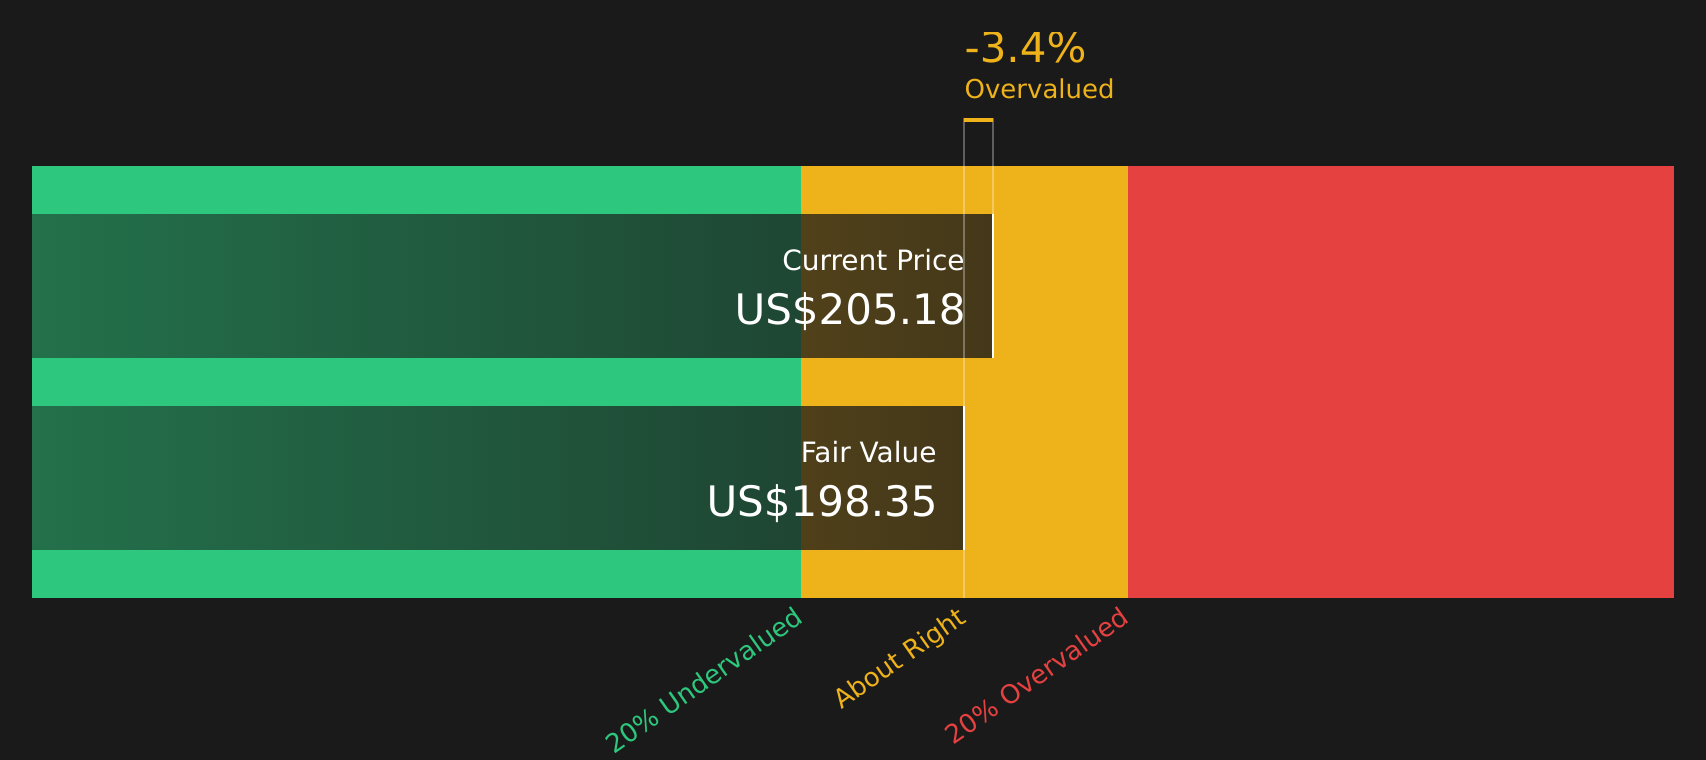
- If you are wondering whether EastGroup Properties at around US$203.89 is offering good value today, the starting point is understanding how its current price lines up against different valuation measures.
- The stock has returned 1.3% over the last 7 days, 7.5% over 30 days, 13.3% year to date, 26.4% over 1 year, 33.1% over 3 years and 54.4% over 5 years, which can influence how investors think about upside and risk at today's level.
- Recent share price moves sit against a backdrop of ongoing interest in listed industrial REITs and continued attention on how companies with warehouse and logistics exposure allocate capital and manage balance sheets. For EastGroup Properties, this context can shape expectations around future asset values, rental trends and the stock's perceived resilience.
- Even with those return figures, EastGroup Properties currently has a valuation score of 0 out of 6, so the next step is to look at what standard valuation approaches say about the stock and then consider a more holistic way to think about value that will be covered at the end of this article.
EastGroup Properties scores just 0/6 on our valuation checks. See what other red flags we found in the full valuation breakdown.
Approach 1: EastGroup Properties Discounted Cash Flow (DCF) Analysis
A Discounted Cash Flow model estimates what a stock could be worth by projecting its future adjusted funds from operations and then discounting those cash flows back to today’s value.
For EastGroup Properties, the model uses last twelve months free cash flow of $474.3 million and projects this forward using analyst estimates for several years, then extends those projections further using Simply Wall St assumptions. For example, projected free cash flow in 2030 is $574.6 million, with intermediate years such as 2026 to 2029 ranging from $403.6 million to $535.4 million. Each of these projected cash flows is discounted back to today using the 2 Stage Free Cash Flow to Equity approach.
Bringing those discounted cash flows together, the model arrives at an estimated intrinsic value of $198.38 per share, compared with the current share price of about $203.89. That suggests the stock is roughly 2.8% above this DCF estimate, which is a small gap and within a reasonable margin of error for this kind of model.
Result: ABOUT RIGHT
EastGroup Properties is fairly valued according to our Discounted Cash Flow (DCF), but this can change at a moment's notice. Track the value in your watchlist or portfolio and be alerted on when to act.
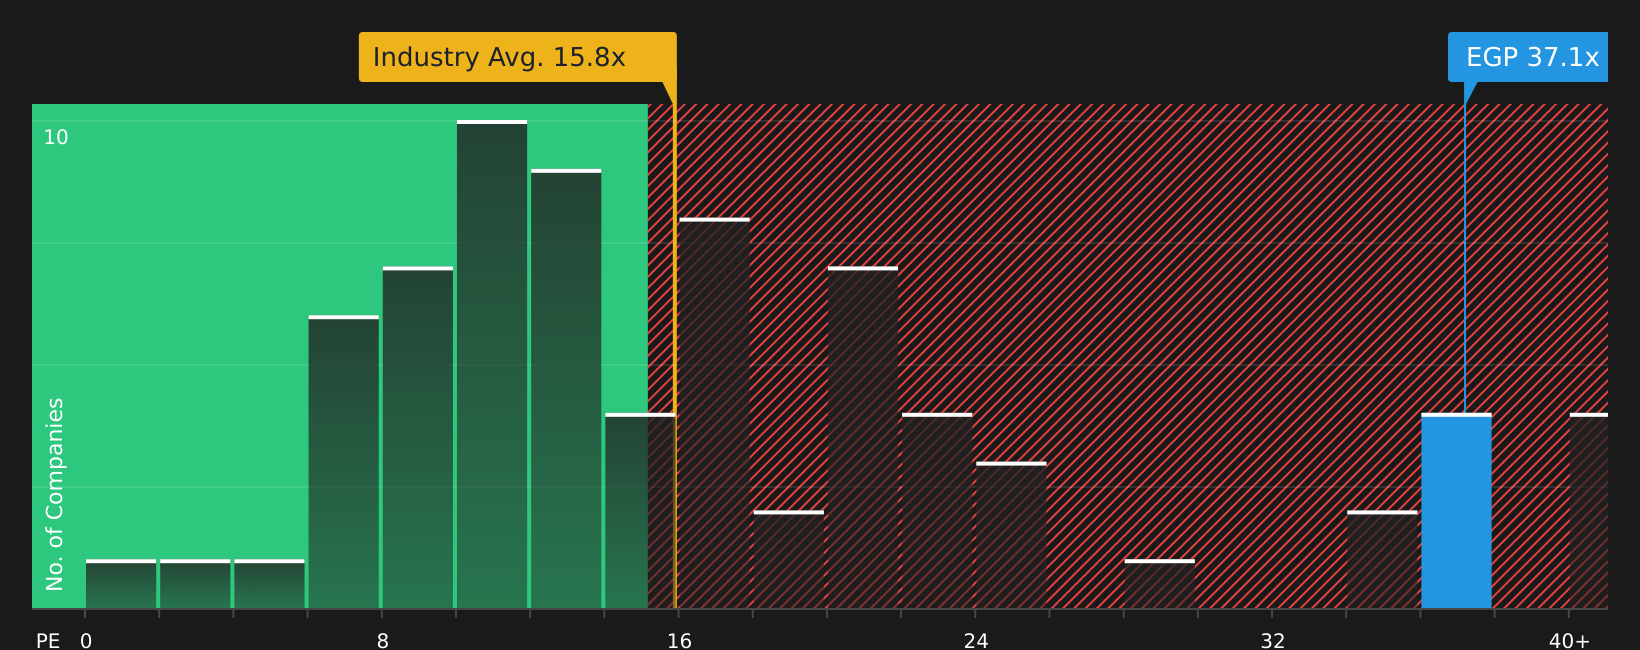
Approach 2: EastGroup Properties Price vs Earnings
For profitable companies, the P/E ratio is a useful way to think about value because it links what you pay for the stock to the earnings that support that price. A higher or lower P/E often reflects what the market is pricing in for future growth and how much risk investors are willing to accept.
For EastGroup Properties, the current P/E is 37.40x. This is above the Industrial REITs industry average of 16.23x and also above the peer average of 27.00x, so the stock trades at a higher multiple than many sector peers. However, simple comparisons like these do not factor in company specific traits such as earnings growth, profitability, size and risk profile.
Simply Wall St’s Fair Ratio metric is designed to capture those elements. For EastGroup Properties, the Fair Ratio is 34.16x, based on factors such as its earnings growth profile, industry, profit margins, market capitalization and risk indicators. Because this approach is tailored to the company, it can be more informative than looking only at broad industry or peer averages. With the actual P/E of 37.40x above the Fair Ratio of 34.16x, the stock screens as overvalued on this measure.
Result: OVERVALUED
P/E ratios tell one story, but what if the real opportunity lies elsewhere? Start investing in legacies, not executives. Discover our 19 top founder-led companies.
Upgrade Your Decision Making: Choose your EastGroup Properties Narrative
Earlier it was mentioned that there is an even better way to understand valuation, so here is an introduction to Narratives. A Narrative is the story you believe about a company, tied directly to numbers like your assumed fair value and your expectations for future revenue, earnings and margins. Instead of looking at ratios in isolation, you connect EastGroup Properties’ business story to a financial forecast and then to a fair value estimate that you can compare with the current share price. Narratives on Simply Wall St are available on the Community page, where millions of investors share and refine their views using the same simple framework. These Narratives update when new information such as earnings reports or news is released, so your fair value view stays current without extra work. This makes it easier to decide whether the stock looks attractive, fully priced or expensive relative to your own numbers, rather than relying only on headline metrics. For example, one investor might see EastGroup Properties as worth far more than today’s price while another might see fair value well below it, based on different assumptions about rents, occupancy and costs.
Do you think there's more to the story for EastGroup Properties? Head over to our Community to see what others are saying!

This article by Simply Wall St is general in nature. We provide commentary based on historical data and analyst forecasts only using an unbiased methodology and our articles are not intended to be financial advice. It does not constitute a recommendation to buy or sell any stock, and does not take account of your objectives, or your financial situation. We aim to bring you long-term focused analysis driven by fundamental data. Note that our analysis may not factor in the latest price-sensitive company announcements or qualitative material. Simply Wall St has no position in any stocks mentioned.