Is It Time To Reassess Newmark Group (NMRK) After Recent Share Price Weakness?
Newmark Group, Inc. Class A NMRK | 0.00 |
- If you are wondering whether Newmark Group's share price reflects its underlying worth today, you are not alone. This article is set up to help you frame that question clearly.
- The stock recently closed at US$14.52, with returns of a 3.8% decline over 7 days, 18.6% decline over 30 days, 14.4% decline year to date and 0.2% decline over the past year, while the 3 year and 5 year returns sit at 89.2% and 50.1% respectively.
- These moves have put valuation back in focus for Newmark Group investors who are weighing shorter term share price swings against its longer term record. Recent company updates and sector headlines are giving the market fresh information to factor into how it prices Newmark Group today, which makes a closer look at valuation especially timely.
- On Simply Wall St's 6 point valuation checklist, Newmark Group currently scores 6 out of 6. Next, we will compare what different valuation methods suggest about the stock's pricing before turning to an even more complete way to think about value at the end of the article.
Approach 1: Newmark Group Discounted Cash Flow (DCF) Analysis
A Discounted Cash Flow, or DCF, model takes estimates of the cash a business could generate in the future and discounts those cash flows back to today. The aim is to arrive at an estimate of what the company might be worth right now.
For Newmark Group, the model used is a 2 Stage Free Cash Flow to Equity approach based on cash flow projections. The company’s last twelve month free cash flow sits at about $121.1 million. Analyst and extrapolated projections in the Simply Wall St model indicate free cash flow of $489 million in 2030, using a path that runs through forecast and estimated figures from 2026 to 2035, all discounted back to today.
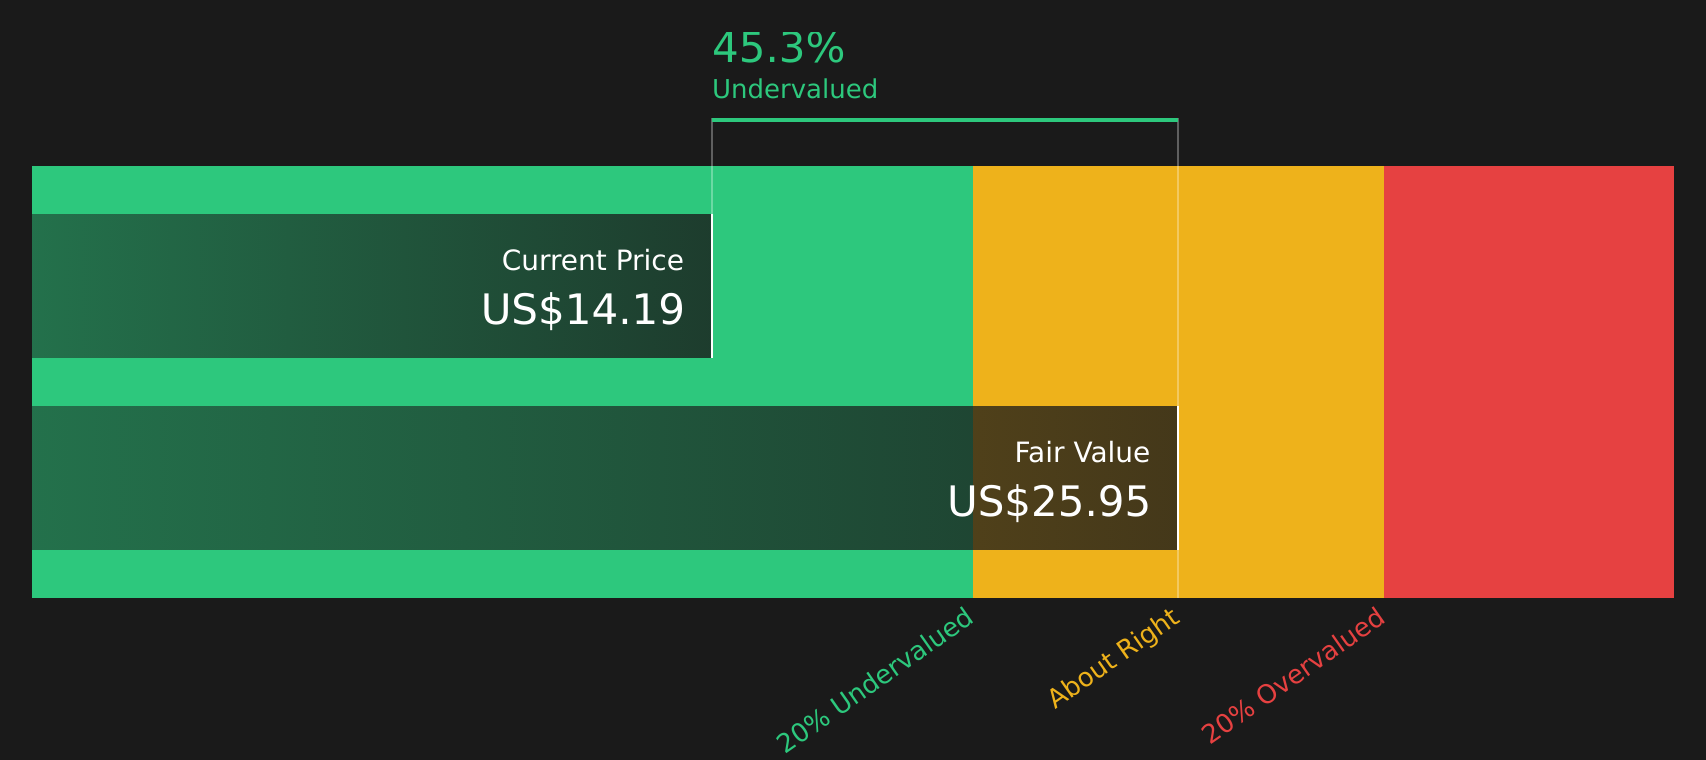
Based on these projections, the DCF model arrives at an estimated intrinsic value of US$26.79 per share, compared with the recent share price of US$14.52. This implies an intrinsic discount of about 45.8%, meaning the model indicates the shares are currently trading below this estimate of fair value.
Result: UNDERVALUED
Our Discounted Cash Flow (DCF) analysis suggests Newmark Group is undervalued by 45.8%. Track this in your watchlist or portfolio, or discover 46 more high quality undervalued stocks.
Approach 2: Newmark Group Price vs Earnings
For a profitable company, the P/E ratio is a straightforward way to link what you pay for the stock to the earnings it generates. It helps you see how many dollars the market is currently paying for each dollar of earnings.
What counts as a "normal" or "fair" P/E depends on what investors expect for growth and how risky they feel the business is. Higher expected growth and lower perceived risk can support a higher P/E, while lower growth expectations or higher risk typically align with a lower P/E.
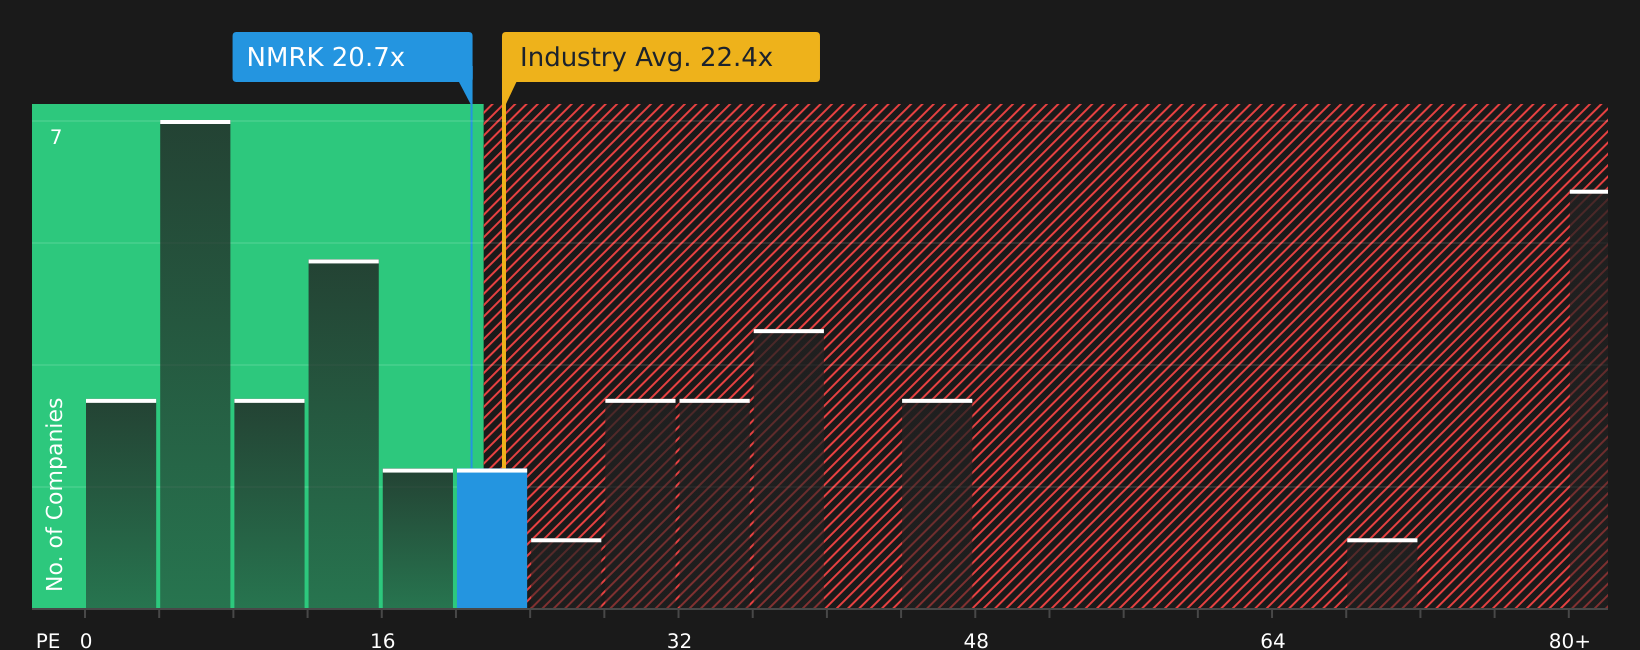
Newmark Group currently trades on a P/E of 20.80x. That sits below the Real Estate industry average P/E of 34.23x and also below the peer group average of 32.15x. Simply Wall St's Fair Ratio for Newmark Group is 22.49x, which is its proprietary view of what P/E might be appropriate given factors such as earnings growth, profit margins, industry, market cap and risk profile.
The Fair Ratio is more tailored than a simple comparison with peers or the broad industry because it adjusts for those company specific characteristics rather than assuming all firms deserve similar multiples. With the Fair Ratio of 22.49x above the current 20.80x, this P/E based view points to the shares being undervalued on earnings.
Result: UNDERVALUED
P/E ratios tell one story, but what if the real opportunity lies elsewhere? Start investing in legacies, not executives. Discover our 19 top founder-led companies.
Upgrade Your Decision Making: Choose your Newmark Group Narrative
Earlier we mentioned that there is an even better way to understand valuation. Let us introduce you to Narratives, which are simple stories that you create about Newmark Group by linking your view of its business to concrete numbers like future revenue, earnings, margins and a fair value estimate. You can then compare that fair value with the current price to help you decide if the stock looks attractive or stretched.
On Simply Wall St, Narratives sit in the Community page and are used by millions of investors as an accessible tool that ties a company’s story to a forecast and then to a valuation. They automatically refresh when new information such as earnings, news or updated analyst targets comes through.
For Newmark Group, for example, one investor might build a more cautious Narrative that lines up with the US$14.00 analyst fair value, while another could build a more optimistic Narrative that aligns with the US$24.00 fair value. You can compare these side by side and decide which story and set of assumptions fit your own view best.
Do you think there's more to the story for Newmark Group? Head over to our Community to see what others are saying!

This article by Simply Wall St is general in nature. We provide commentary based on historical data and analyst forecasts only using an unbiased methodology and our articles are not intended to be financial advice. It does not constitute a recommendation to buy or sell any stock, and does not take account of your objectives, or your financial situation. We aim to bring you long-term focused analysis driven by fundamental data. Note that our analysis may not factor in the latest price-sensitive company announcements or qualitative material. Simply Wall St has no position in any stocks mentioned.