Is It Time To Reassess Nexa Resources (NEXA) After Its 123% One-Year Surge?
Nexa Resources S.A. NEXA | 11.07 | +0.73% |
- If you are wondering whether Nexa Resources at around US$12.38 is still attractively priced after a strong run, you are not alone. This article is built to help you frame that value question clearly.
- The stock has had a mixed short term patch with a 3.1% decline over the last 7 days, but it also shows returns of 15.3% over 30 days, 40.8% year to date, 122.9% over 1 year and 95.9% over 3 years, as well as 43.4% over 5 years.
- Recent moves are taking place against a backdrop of continuing interest in metals and mining companies and ongoing sector specific headlines that influence sentiment toward materials stocks. For Nexa Resources, this context matters because it shapes how investors interpret both the risks and the potential in the current share price.
- On our valuation checks, Nexa Resources scores 4 out of 6. We will unpack this using several common valuation approaches, and we will also finish by looking at a more complete way to think about valuation that goes beyond simple ratios or models.
Approach 1: Nexa Resources Discounted Cash Flow (DCF) Analysis
A Discounted Cash Flow, or DCF, model takes the cash Nexa Resources is expected to generate in the future and then discounts those cash flows back to what they might be worth in today’s dollars.
For Nexa Resources, the latest twelve month free cash flow is reported at $7.64 million. Analysts and model estimates then project free cash flows each year out to 2035, with figures such as $208 million in 2026 and $168 million in 2030. Beyond the first few analyst covered years, Simply Wall St extrapolates the remaining projections to complete the 2 Stage Free Cash Flow to Equity model.
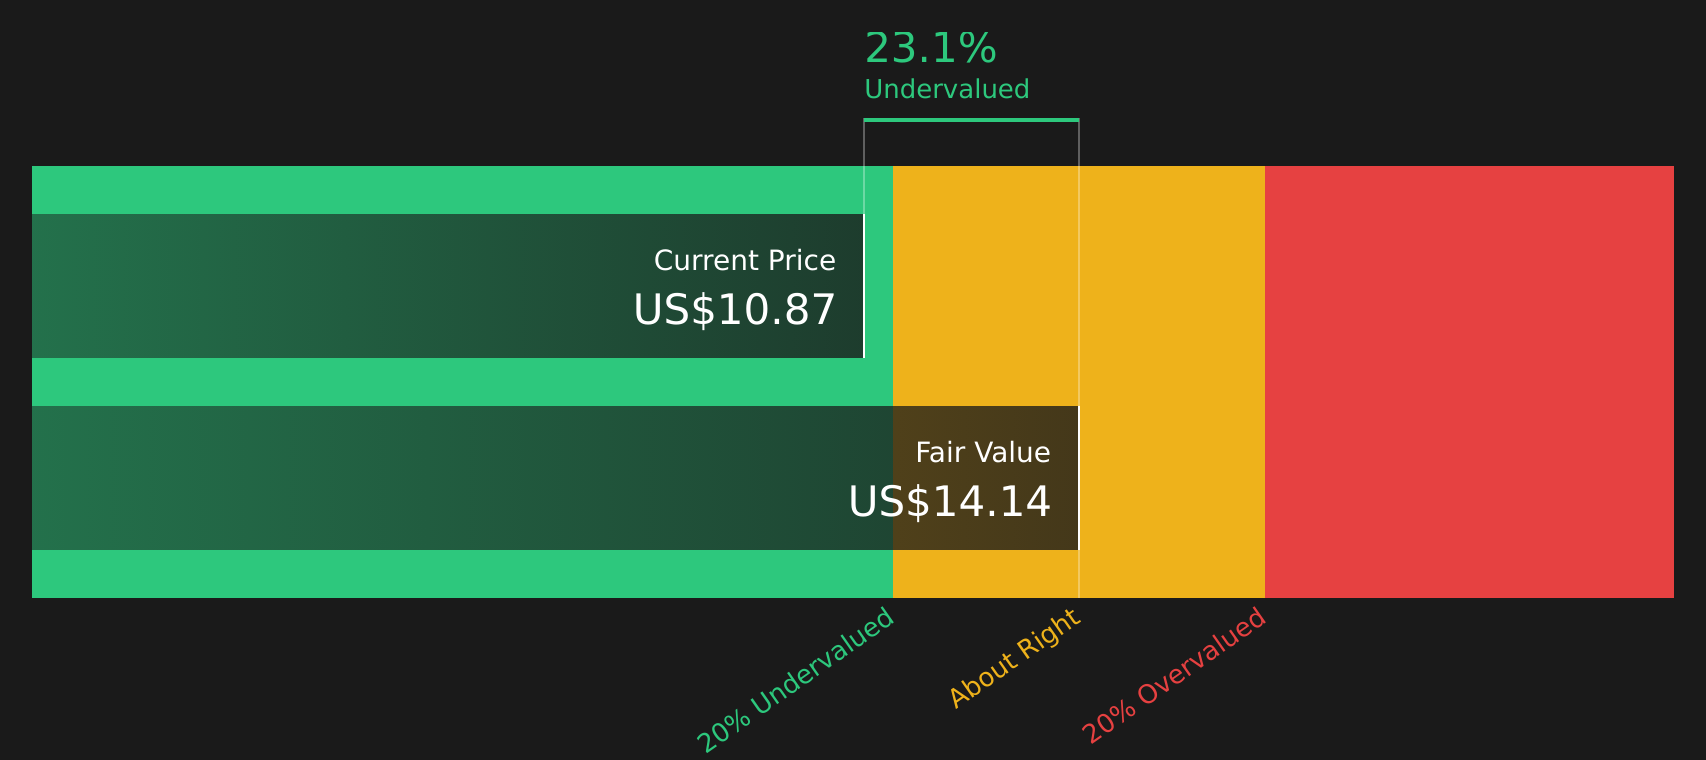
When all of those projected cash flows are discounted back and summed, the model arrives at an estimated intrinsic value of about $14.44 per share. Compared with a recent share price around $12.38, this implies roughly a 14.3% discount, which indicates that Nexa Resources is trading below this particular estimate of fair value.
Result: UNDERVALUED
Our Discounted Cash Flow (DCF) analysis suggests Nexa Resources is undervalued by 14.3%. Track this in your watchlist or portfolio, or discover 51 more high quality undervalued stocks.
Approach 2: Nexa Resources Price vs Sales
For Nexa Resources, price to sales, or P/S, is the preferred multiple, which can be a useful cross check for companies where revenue is a more stable reference point than earnings. It tells you how much investors are paying for each dollar of sales.
In general, higher growth expectations and lower perceived risk can justify a higher “normal” or “fair” valuation multiple, while slower growth or higher risk usually point to a lower one. That concept still applies when you look at P/S instead of P/E.
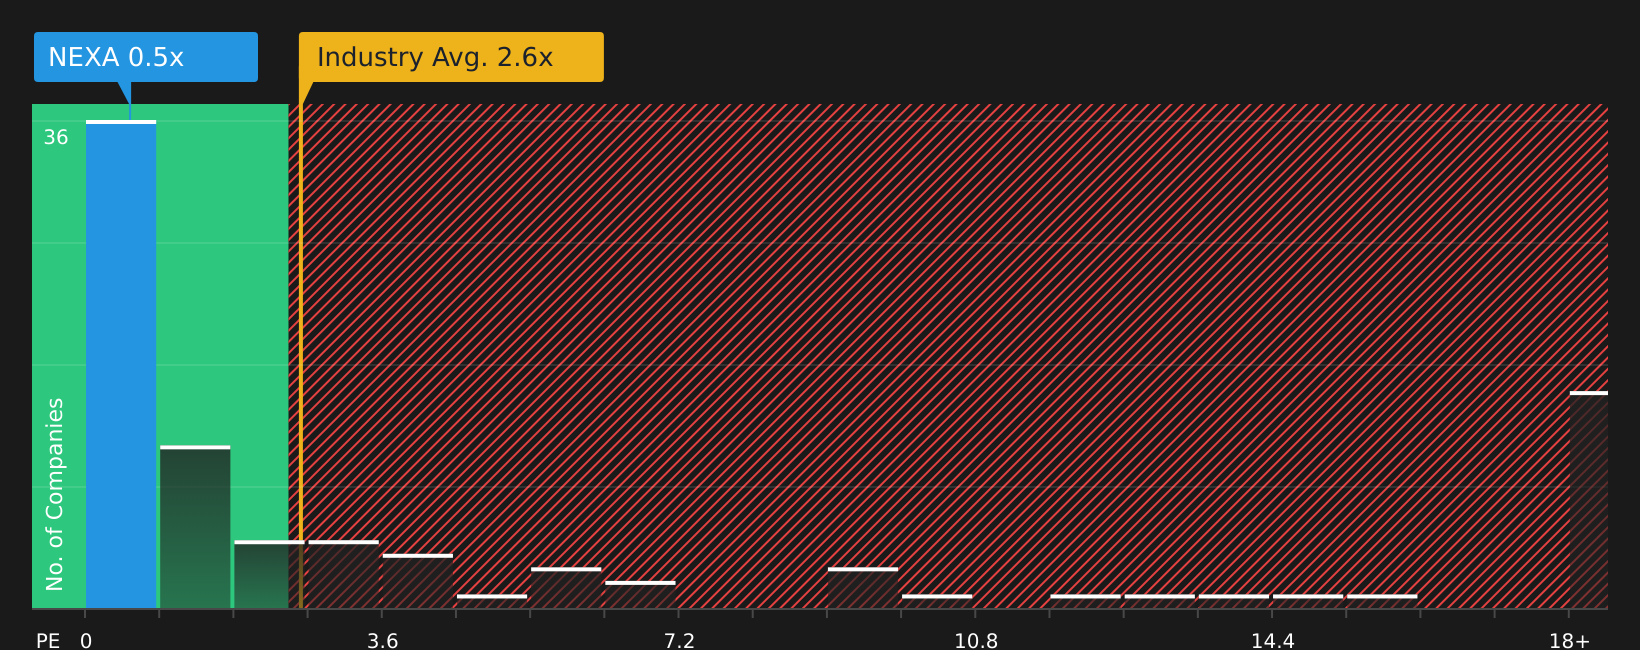
Nexa Resources currently trades on a P/S of 0.58x. This sits well below the Metals and Mining industry average P/S of 2.63x and also below the peer group average of 9.73x. Simply Wall St’s Fair Ratio for Nexa Resources is 0.80x, which is the P/S level its model suggests based on factors such as earnings growth, industry, profit margin, market cap and risk profile.
The Fair Ratio is more tailored than a simple comparison with peers or the industry because it adjusts for Nexa Resources specific characteristics rather than assuming it should trade in line with broad averages.
Compared with the Fair Ratio of 0.80x, the current P/S of 0.58x indicates that Nexa Resources appears undervalued on this metric.
Result: UNDERVALUED
P/S ratios tell one story, but what if the real opportunity lies elsewhere? Start investing in legacies, not executives. Discover our 22 top founder-led companies.
Upgrade Your Decision Making: Choose your Nexa Resources Narrative
Earlier we mentioned that there is an even better way to understand valuation. On Simply Wall St’s Community page you can use Narratives, where you spell out your story for Nexa Resources in plain language, tie that story to specific forecasts for revenue, earnings and margins, and let the platform convert those assumptions into a Fair Value you can compare with the current price. The Narrative updates automatically when fresh news or earnings arrive. For example, one investor might set a cautious Fair Value near US$5.00 based on modest revenue growth and a 5.6x future P/E, while another might land closer to US$9.89 using slightly higher growth, stronger margins and a 9.6x future P/E. Both can then see clearly how their view, their numbers and their Fair Value link together.
Do you think there's more to the story for Nexa Resources? Head over to our Community to see what others are saying!

This article by Simply Wall St is general in nature. We provide commentary based on historical data and analyst forecasts only using an unbiased methodology and our articles are not intended to be financial advice. It does not constitute a recommendation to buy or sell any stock, and does not take account of your objectives, or your financial situation. We aim to bring you long-term focused analysis driven by fundamental data. Note that our analysis may not factor in the latest price-sensitive company announcements or qualitative material. Simply Wall St has no position in any stocks mentioned.