Is It Time To Reassess Nike (NKE) After Its Steep Share Price Slide
NIKE, Inc. Class B NKE | 0.00 |
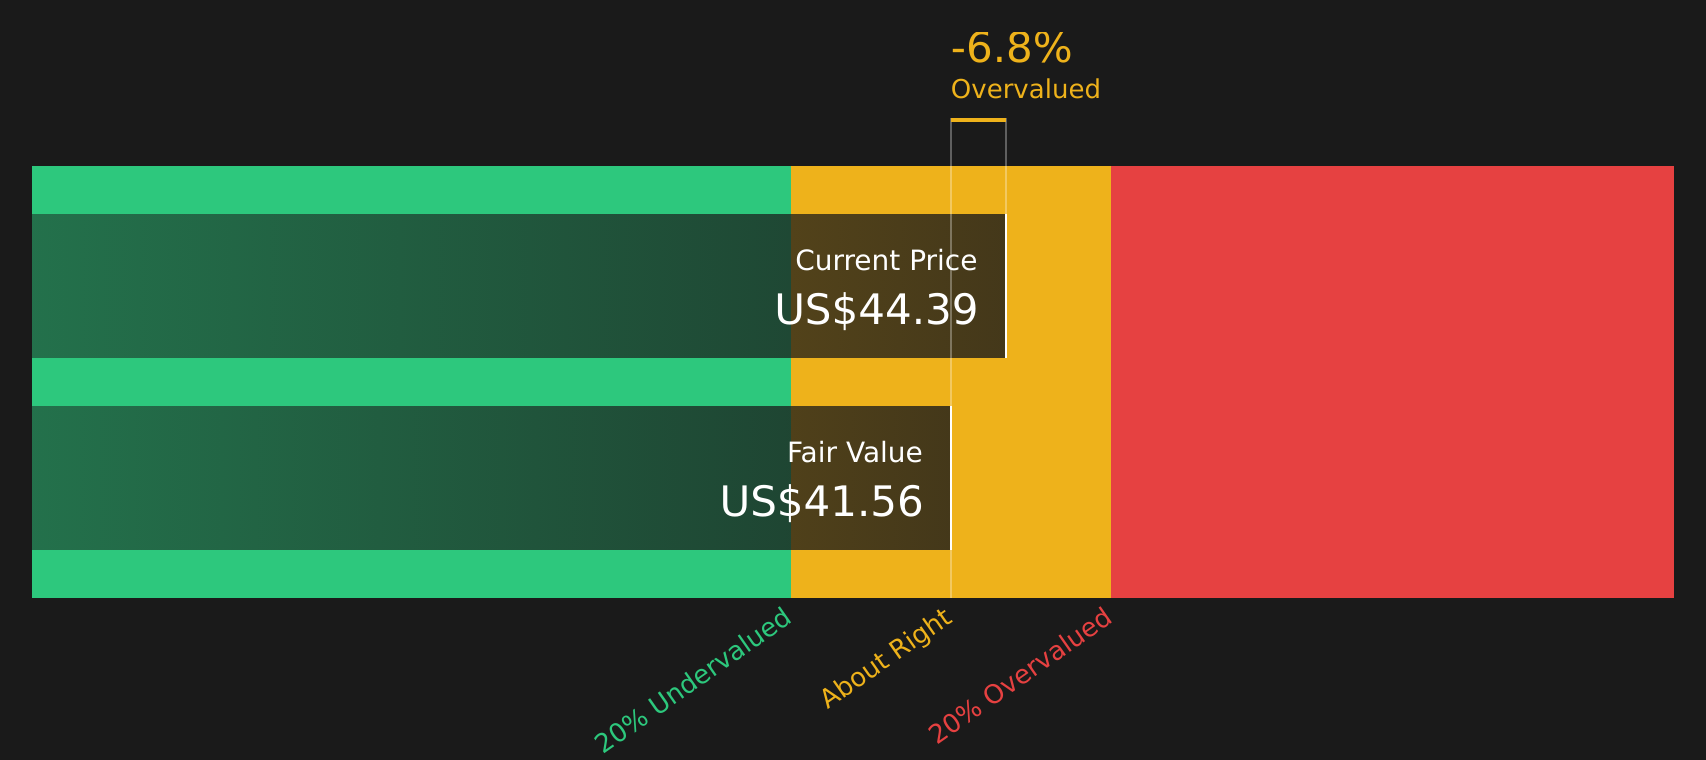
- With NIKE at a last close of US$44.39, investors may be asking whether that price still reflects the strength of its brand or whether the stock is pricing in too much caution. This article focuses squarely on what you are getting for that price.
- Recent share price moves, including a 2.8% decline over the last 7 days, a 13.4% decline over 30 days, and a 29.9% decline year to date, have sharpened questions about both risk and potential upside, especially given the 19.3% 1 year and 62.9% 3 year declines.
- These moves sit against a backdrop of ongoing interest in NIKE as a major global sportswear brand. The market regularly reassesses how current trends and competitive pressures might affect its long term appeal. For long term holders and new investors alike, that context matters when thinking about what a fair price looks like today.
- NIKE currently has a valuation score of 2/6. The sections that follow will walk through how different valuation methods interpret that, before looking at an even more rounded way to think about value at the end of the article.
NIKE scores just 2/6 on our valuation checks. See what other red flags we found in the full valuation breakdown.
Approach 1: NIKE Discounted Cash Flow (DCF) Analysis
A Discounted Cash Flow, or DCF, model takes projected future cash flows and discounts them back to today, aiming to estimate what those future streams are worth in present terms.
For NIKE, the model uses a 2 Stage Free Cash Flow to Equity approach. The latest twelve month free cash flow is about $1.04b. Analysts and extrapolations then project free cash flow rising to $3.91b by 2030, with ten year projections for each year between 2026 and 2035 supplied by a mix of analyst estimates and Simply Wall St extrapolations.
When those yearly figures are discounted back to today and added together, the model arrives at an estimated intrinsic value of US$38.55 per share. Compared with the last close of US$44.39, the DCF output points to the shares trading at about a 15.2% premium to this estimate, so on this model NIKE screens as overvalued rather than cheap right now.
Result: OVERVALUED
Our Discounted Cash Flow (DCF) analysis suggests NIKE may be overvalued by 15.2%. Discover 53 high quality undervalued stocks or create your own screener to find better value opportunities.
Approach 2: NIKE Price vs Earnings
P/E is a common way to value profitable companies because it links what you pay directly to the earnings that support that price. Higher expected growth or lower perceived risk can justify a higher P/E, while slower growth or higher risk tends to point to a lower, more cautious “normal” range.
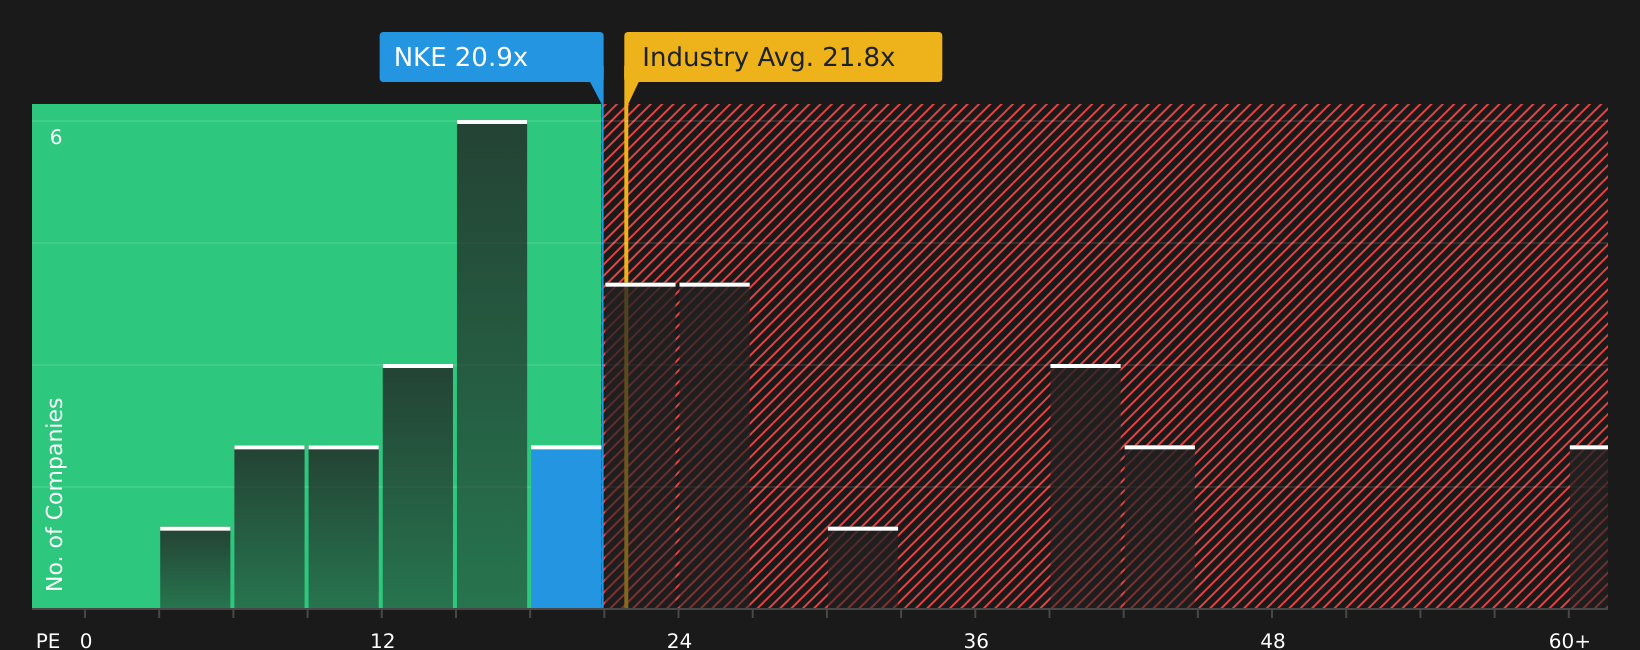
NIKE trades on a P/E of 29.22x. That sits above the Luxury industry average P/E of 19.36x, but below the peer group average of 33.82x. To move beyond simple comparisons, Simply Wall St uses a “Fair Ratio” which estimates what a reasonable P/E might be for NIKE given factors such as its earnings growth profile, margins, size and risk characteristics.
Because this Fair Ratio of 29.92x is tailored to NIKE, it can be more informative than a basic check against peers or the broader industry, which may have very different business models or risk profiles. Set against the actual P/E of 29.22x, NIKE looks only slightly below this Fair Ratio, suggesting the market price is close to what this framework would consider a reasonable level today.
Result: ABOUT RIGHT
P/E ratios tell one story, but what if the real opportunity lies elsewhere? Start investing in legacies, not executives. Discover our 18 top founder-led companies.
Upgrade Your Decision Making: Choose your NIKE Narrative
Earlier we mentioned that there is an even better way to think about value, and on Simply Wall St that comes through Narratives, where you combine your view of NIKE’s story with your own forecast and fair value, then see how it stacks up against the current price in a way that updates as new news and earnings arrive.
In practice a Narrative is your version of the company, tying together what you think NIKE can do on revenue, earnings and margins with the price you believe is fair. This way the story and the numbers sit in one place instead of feeling disconnected.
On the Community page, Narratives are set up so you can pick an assumption set that fits how you see NIKE, have the platform turn that into a full forecast and Fair Value, and then quickly compare that value to today’s US$44.39 share price to decide whether the market looks generous or cautious to you.
Because Narratives update automatically when fresh information drops, you are not stuck with a static model, and you can see in seconds how a new quarter or news item changes the gap between price and value for your chosen story.
For NIKE right now, one community member’s most cautious Narrative points to a Fair Value of about US$26.89, while one of the most optimistic sits near US$109.11. Others sit in between at figures like US$43.01 or US$56.47. This shows how the same company can look very different once you plug in different expectations for margins, growth, or P/E.
For NIKE however we'll make it really easy for you with previews of two leading NIKE Narratives:
Fair value: US$75.23
Gap to price: about 41% below this fair value at the recent US$44.39 share price
Revenue growth assumption: 4%
- This narrative sees Direct To Consumer as a double edged sword, supporting margins but also opening the door for more price driven competition and a more fragmented market.
- It treats Nike’s brand strength as real but questions how far product innovation alone can support a premium P/E if cheaper rivals keep scaling.
- The author expects competition and consumer pressure to limit market share, while still allowing Nike to grow revenue and earnings over time from a leaner cost base.
Fair value: US$43.01
Gap to price: about 3% above this fair value at the recent US$44.39 share price
Revenue growth assumption: 10%
- This narrative highlights Nike’s global brand, market leadership and scale advantages, along with cost efficiency and broad pricing reach.
- It points to a solid balance sheet, ongoing product development and a growing Direct To Consumer presence as support for the business model.
- Even with those positives, the author views the recent market price as richer than the implied value from cash flow and earnings based work, so sees limited room for error at current levels.
If you want to see how other investors are joining the dots between story, forecasts and fair value, you can review more community views and build your own version of NIKE in the Narratives tool, then track how your thesis stacks up each time new data lands. Curious how numbers become stories that shape markets? Explore Community Narratives.
Do you think there's more to the story for NIKE? Head over to our Community to see what others are saying!

This article by Simply Wall St is general in nature. We provide commentary based on historical data and analyst forecasts only using an unbiased methodology and our articles are not intended to be financial advice. It does not constitute a recommendation to buy or sell any stock, and does not take account of your objectives, or your financial situation. We aim to bring you long-term focused analysis driven by fundamental data. Note that our analysis may not factor in the latest price-sensitive company announcements or qualitative material. Simply Wall St has no position in any stocks mentioned.