Is It Time To Reassess Papa John’s (PZZA) After Its Recent Share Price Weakness
PAPA John'S International PZZA | 0.00 |
- If you are wondering whether Papa John's International at around US$34.21 is a bargain or a value trap, the answer starts with understanding how its current share price lines up against different valuation lenses.
- The stock has inched up 2.4% over the past week, but is down 3.6% over the past month, 15.1% year to date, and 20.7% over the last year. This raises fair questions about both risk and potential upside from here.
- Recent coverage has focused on the company’s position in the competitive pizza and broader quick service restaurant space, including commentary on brand strength, store footprint, and franchise economics. This kind of context helps explain why the market may be reassessing how much it is willing to pay for the stock today.
- Papa John's International currently scores 1 out of 6 on Simply Wall St's valuation checks. Next up is a closer look at how different methods like DCF and valuation multiples stack up, and why an even richer way of thinking about value will matter by the end of this article.
Papa John's International scores just 1/6 on our valuation checks. See what other red flags we found in the full valuation breakdown.
Approach 1: Papa John's International Discounted Cash Flow (DCF) Analysis
A Discounted Cash Flow model starts with estimates of the cash Papa John's International can generate in the future, then discounts those cash flows back to today using a required return, giving an estimate of what the entire business might be worth per share.
For Papa John's International, the model uses a 2 Stage Free Cash Flow to Equity approach. The company’s latest twelve month Free Cash Flow is about $30.83 million. Analysts provide forecasts for the next few years, and Simply Wall St then extends those estimates so that projected Free Cash Flow reaches about $114.05 million by 2035, based on the supplied 10 year path of cash flows.
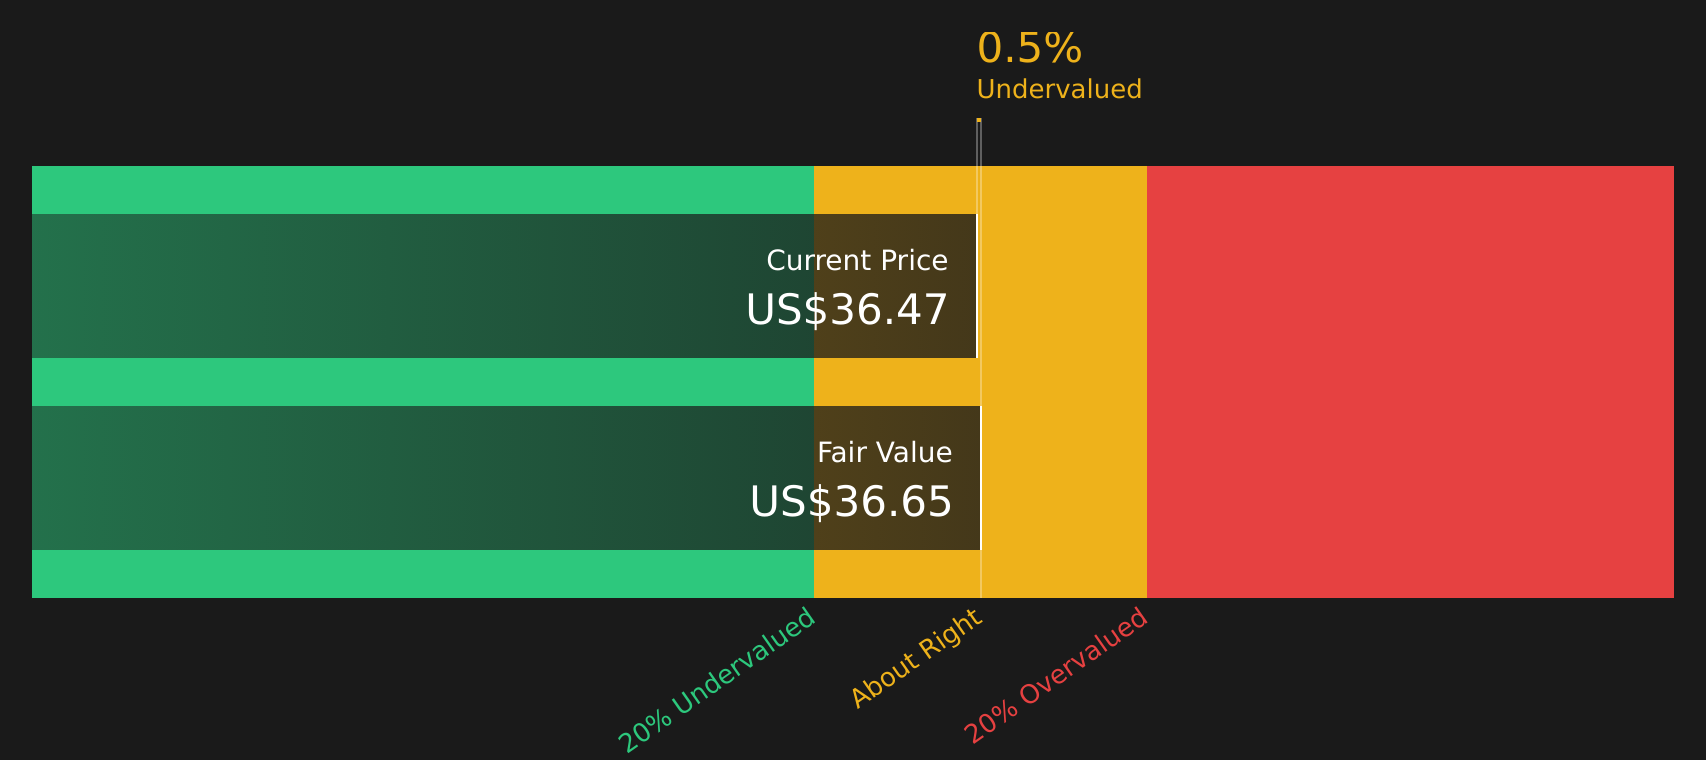
Rolling all those projected cash flows together, the DCF model arrives at an estimated intrinsic value of about $36.93 per share. Compared with the current share price of roughly $34.21, this implies the stock trades at about a 7.4% discount, which is a relatively small gap.
Result: ABOUT RIGHT
Papa John's International is fairly valued according to our Discounted Cash Flow (DCF), but this can change at a moment's notice. Track the value in your watchlist or portfolio and be alerted on when to act.
Approach 2: Papa John's International Price vs Earnings
For a profitable company, the P/E ratio is a useful shortcut because it links what you pay for the stock directly to the earnings it is currently generating. It is a quick way to see how many dollars investors are willing to pay for each dollar of earnings.
What counts as a “normal” P/E often reflects two big inputs: how confident investors are in the company’s future earnings growth, and how much risk they see in those earnings. Higher expected growth or lower perceived risk can justify a higher P/E, while slower growth or higher risk usually implies a lower P/E.
Papa John's International is trading on a P/E of 40.93x, compared with the Hospitality industry average of about 20.31x and a peer group average of 34.04x. Simply Wall St’s Fair Ratio for the stock is 37.53x. This Fair Ratio is a proprietary estimate of what the P/E “should” be, based on factors such as earnings growth, industry, profit margins, market cap and company specific risks.
Because the Fair Ratio bakes in these company level drivers, it offers a more tailored reference point than a simple industry or peer comparison. With the current P/E modestly above the 37.53x Fair Ratio, the stock screens as slightly expensive on this metric.
Result: OVERVALUED

P/E ratios tell one story, but what if the real opportunity lies elsewhere? Start investing in legacies, not executives. Discover our 20 top founder-led companies.
Upgrade Your Decision Making: Choose your Papa John's International Narrative
Earlier it was mentioned that there is an even better way to understand valuation. This is where Narratives come in, giving you a simple story that links your view of Papa John's International to a forecast and then to a Fair Value that you can compare with the current share price.
A Narrative on Simply Wall St is your own explanation for why you think Papa John's International should be worth a certain amount. It combines your assumptions for future revenue, earnings and margins with a clear Fair Value number rather than relying only on standard ratios.
These Narratives sit inside the Community page on Simply Wall St, where millions of investors share different stories about the same stock. Each story is backed by an explicit financial forecast that updates automatically as new news, earnings or guidance are added to the platform.
For Papa John's International today, one Narrative might line up with the higher Fair Value from bullish analysts at about US$49.71, while another might reflect the more cautious Fair Value around US$32.00. By seeing where your own assumptions fit between those views, you can decide whether the current price looks above or below what you think the stock is worth.
For Papa John's International however we will make it really easy for you with previews of two leading Papa John's International Narratives:
Fair value in this bullish narrative: about US$37.36 per share.
At the recent price around US$34.21, this narrative implies the stock is trading at roughly an 8.4% discount to its fair value.
Revenue trend in the forecast: revenue is assumed to decline about 2.97% per year over the next few years.
- Focus on product and menu moves, higher marketing spend, and loyalty programs to deepen customer engagement and support future earnings.
- Efforts to lower build costs, refranchise stores, and tighten the supply chain are expected to help margins over time despite current pressures.
- Analysts using this view cluster around a fair value near US$37, with higher targets assuming earnings reach about US$92.3 million by 2029 and the stock trades on a lower P/E multiple than today.
Fair value in this bearish narrative: about US$32.00 per share.
At the recent price around US$34.21, this narrative implies the stock is trading at roughly a 6.9% premium to its fair value.
Revenue trend in the forecast: revenue is assumed to decline about 2.47% per year over the next few years.
- Emphasis on headwinds from changing consumer preferences, higher labor and food costs, and reliance on third party delivery platforms that may pressure profitability.
- Store closures and mixed performance in some regions are seen as limiting systemwide sales and royalty growth, even with ongoing digital and menu initiatives.
- Analysts using this view anchor around a fair value near US$32, with assumptions that earnings reach about US$77.6 million by 2029 and the stock trades on a mid teens P/E multiple.
These two Narratives frame a reasonable range of outcomes around Papa John's International today. Where you land between them comes down to how confident you are in margin recovery, traffic stabilization, and the impact of any future corporate actions on shareholder value.
To see how these results tie into long-term growth, risks, and valuation, check out the full range of community narratives for Papa John's International on Simply Wall St. Add the company to your watchlist or portfolio so you'll be alerted when the story evolves.
Do you think there's more to the story for Papa John's International? Head over to our Community to see what others are saying!

This article by Simply Wall St is general in nature. We provide commentary based on historical data and analyst forecasts only using an unbiased methodology and our articles are not intended to be financial advice. It does not constitute a recommendation to buy or sell any stock, and does not take account of your objectives, or your financial situation. We aim to bring you long-term focused analysis driven by fundamental data. Note that our analysis may not factor in the latest price-sensitive company announcements or qualitative material. Simply Wall St has no position in any stocks mentioned.