Is It Time To Reassess Procter & Gamble (PG) After Its Recent Share Price Pullback?
Procter & Gamble Company PG | 143.12 | -0.67% |
- If you are wondering whether Procter & Gamble’s current share price offers fair value or not, you are not alone. This article is built to help you size that up clearly.
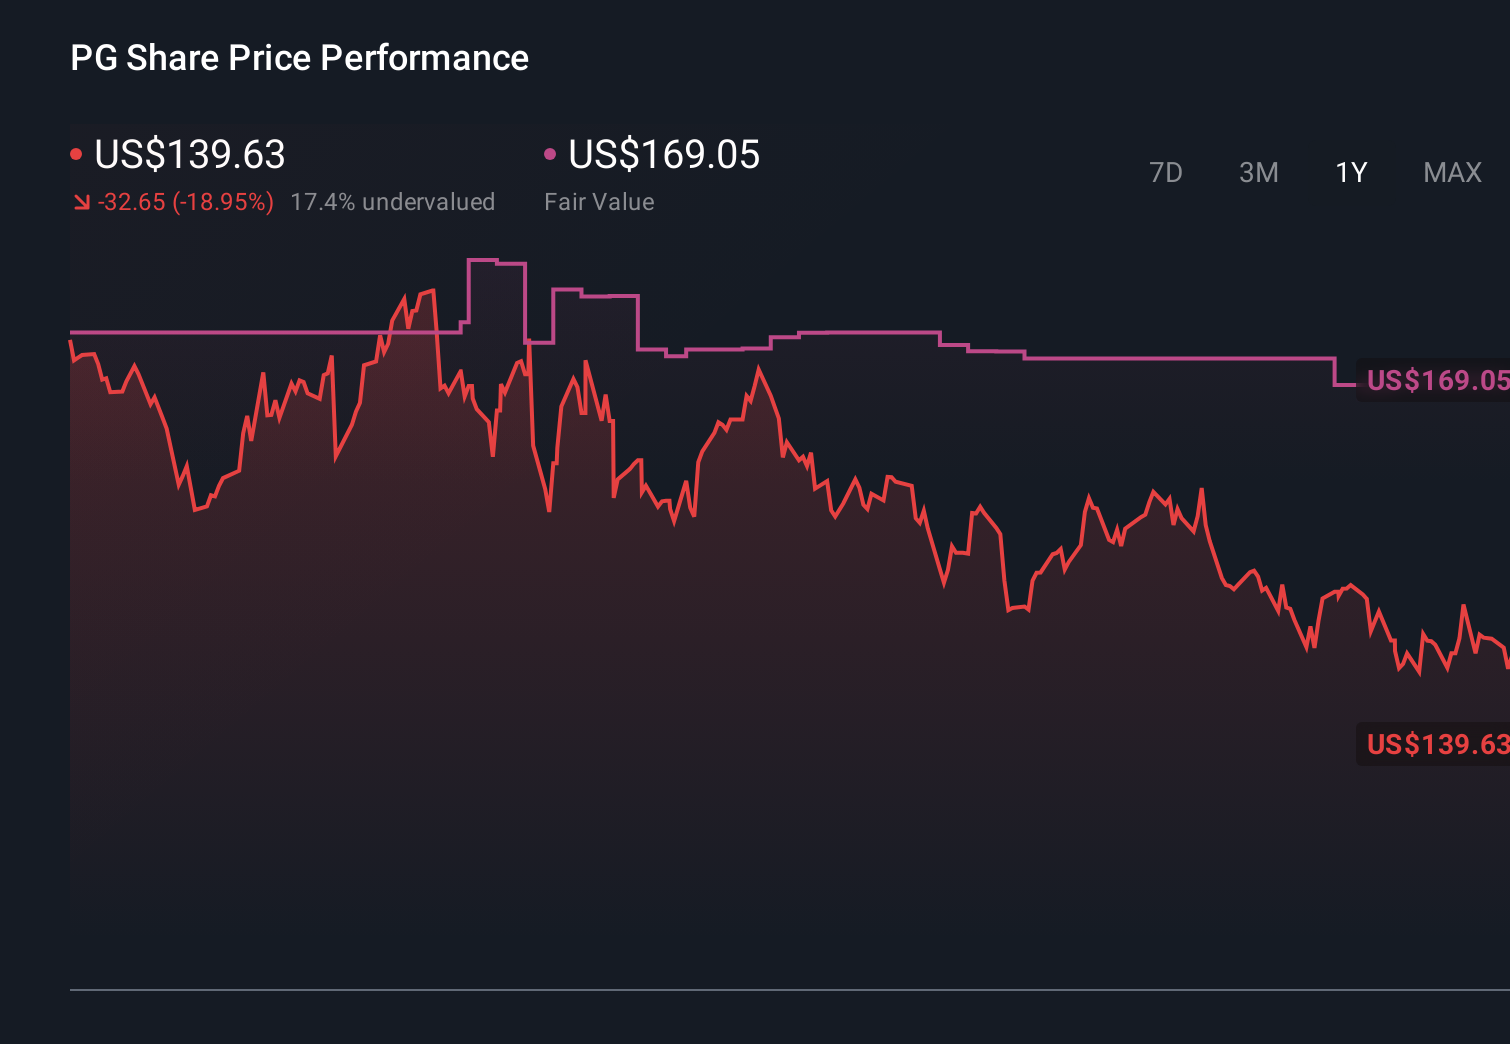
- The stock last closed at US$141.87, with returns of 0.1% over 7 days, 1.5% over 30 days, 0.1% year to date, an 8.2% decline over 1 year and 19.3% over 5 years. These figures may have some investors reassessing both its growth potential and risk profile.
- Recent coverage has focused on Procter & Gamble as a staple name in consumer goods, with investors paying attention to how it is positioned in everyday household categories and its brand strength across its portfolio. This context matters when you think about why the share price has moved the way it has and how the market is currently treating the stock.
- Our valuation work gives Procter & Gamble a score of 4 out of 6 on our value checks. Next, we will walk through the different valuation methods behind that score, before finishing with a view on an even better way to frame the company’s valuation story.
Approach 1: Procter & Gamble Discounted Cash Flow (DCF) Analysis
A Discounted Cash Flow, or DCF, model estimates what a company might be worth by projecting its future cash flows and then discounting those back to today using a required rate of return.
For Procter & Gamble, the model used is a 2 Stage Free Cash Flow to Equity approach. The company’s latest twelve month free cash flow is about $15.4b. Based on analyst inputs for the next few years, and then extrapolated estimates beyond that, Simply Wall St projects free cash flow reaching about $22.5b in 2035. Figures for years such as 2026 and 2028 sit in the mid to high teens in billions of dollars along that path.
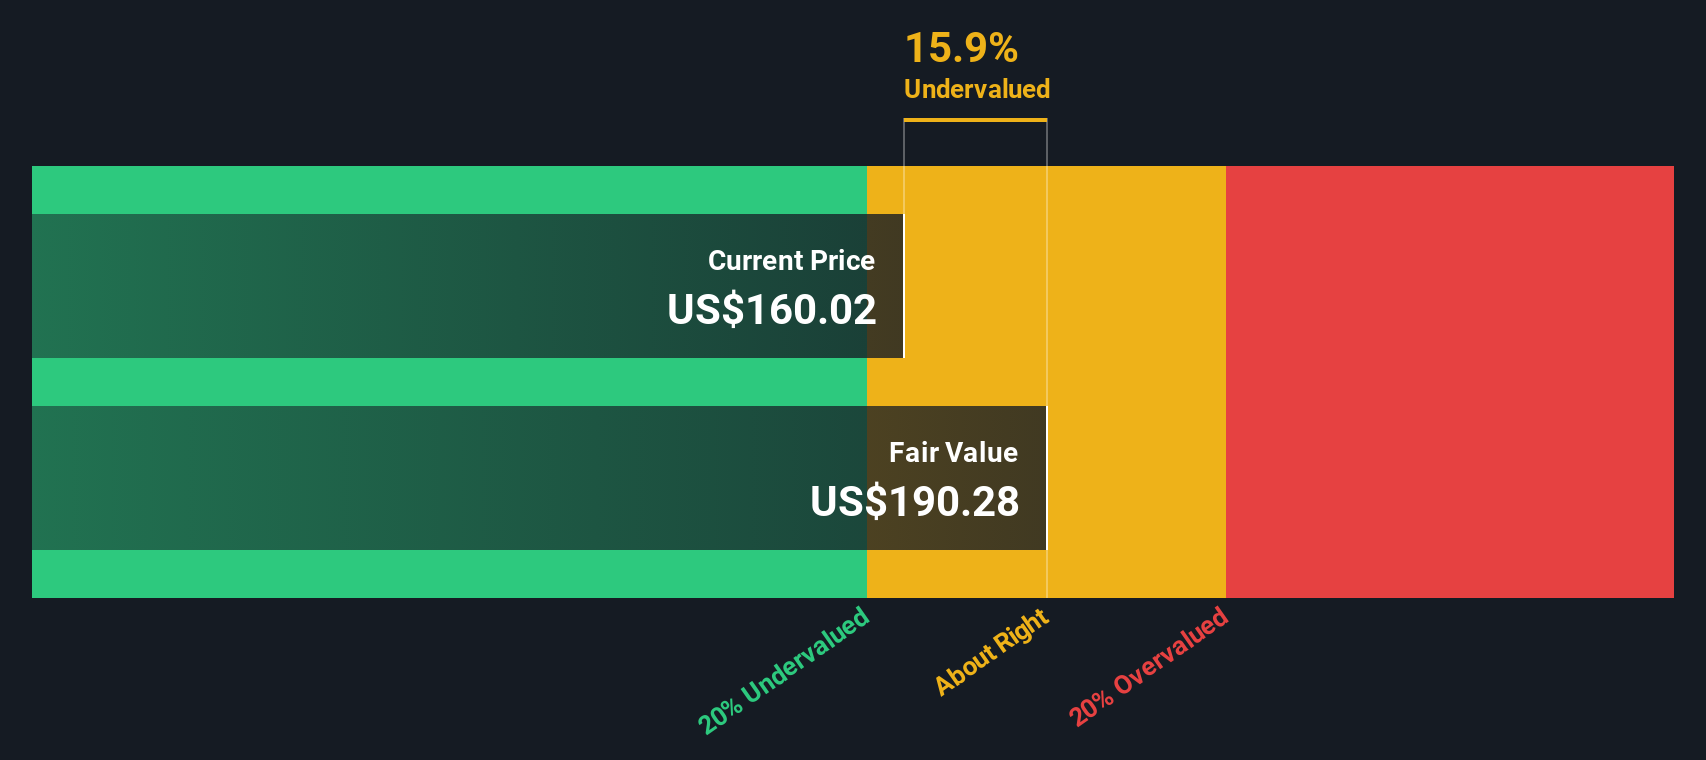
When those projected cash flows are discounted back to today, the DCF model arrives at an estimated intrinsic value of about $194.19 per share. Compared with the recent share price of $141.87, this implies the stock is around 26.9% undervalued according to this cash flow based view.
Result: UNDERVALUED
Our Discounted Cash Flow (DCF) analysis suggests Procter & Gamble is undervalued by 26.9%. Track this in your watchlist or portfolio, or discover 879 more undervalued stocks based on cash flows.
Approach 2: Procter & Gamble Price vs Earnings
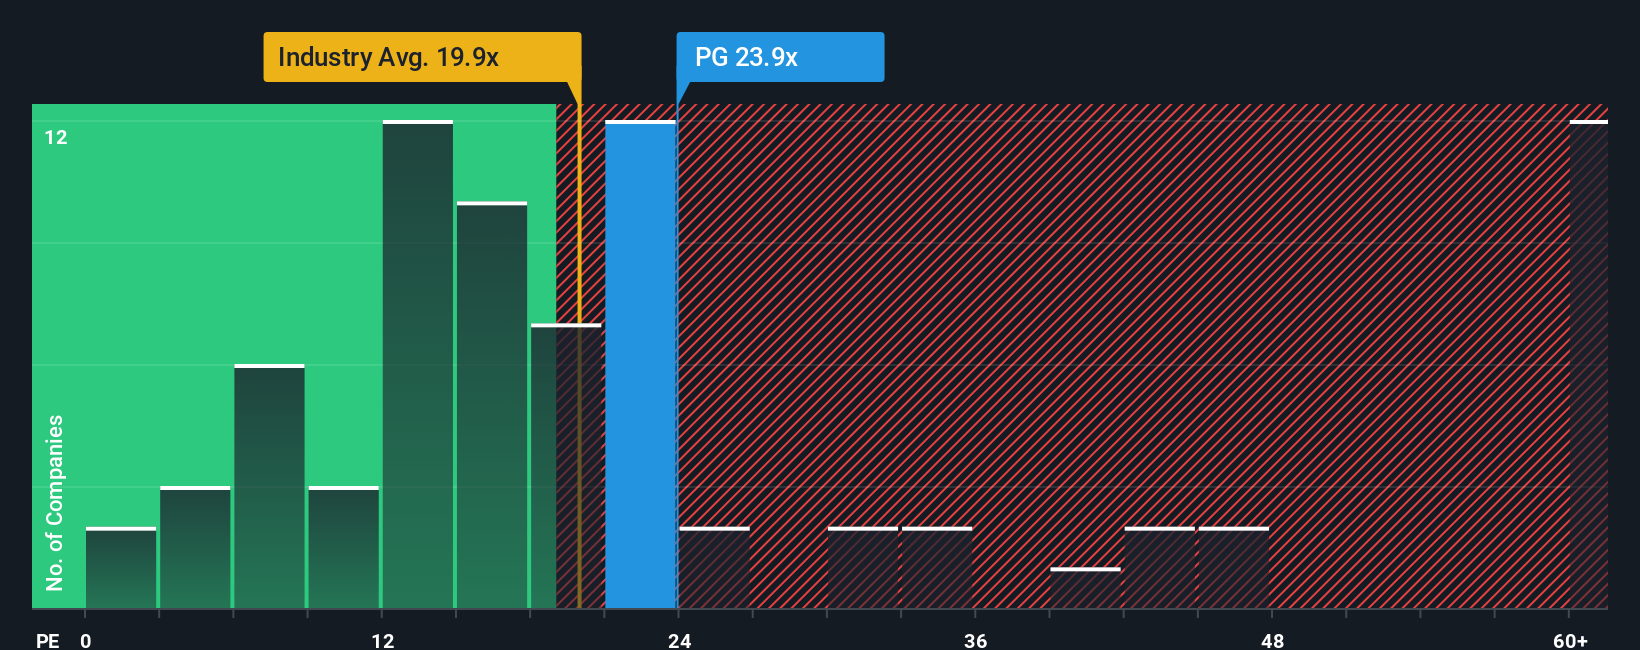
For a company that is generating profits, the P/E ratio is a straightforward way to connect the share price with the earnings that support it. It lets you see how many dollars investors are currently willing to pay for each dollar of earnings.
What feels like a “normal” or “fair” P/E depends on what investors expect for future earnings growth and how much risk they see in those earnings. Higher expected growth or lower perceived risk can justify a higher P/E, while slower expected growth or higher risk usually points to a lower P/E.
Procter & Gamble currently trades on a P/E of 20.12x. That sits close to the peer group average of 20.44x and above the Household Products industry average of 17.04x. Simply Wall St’s Fair Ratio for Procter & Gamble is 20.98x, which is its proprietary estimate of what the P/E “should” be given factors such as the company’s earnings profile, industry, profit margins, market cap and key risks.
The Fair Ratio is often more useful than a simple comparison to peers or the broad industry because it adjusts for differences in growth, risk and profitability, rather than assuming all companies deserve the same multiple. With the Fair Ratio at 20.98x and the actual P/E at 20.12x, the stock looks slightly undervalued on this measure.
Result: UNDERVALUED
P/E ratios tell one story, but what if the real opportunity lies elsewhere? Discover 1444 companies where insiders are betting big on explosive growth.
Upgrade Your Decision Making: Choose your Procter & Gamble Narrative
Earlier we mentioned that there is an even better way to understand valuation. Let us introduce you to Narratives, a simple framework on Simply Wall St’s Community page. With Narratives, you connect your view of Procter & Gamble’s business to a financial forecast, link that to a Fair Value, and then compare that Fair Value to the current price. The platform updates your Narrative automatically when new earnings or news arrive. You can then see, for example, one investor anchoring on a Fair Value around US$119.81 with modest revenue growth and margins near 20%, while another leans toward about US$168.13 with revenue growth just above 3% and profit margins near 19.6%. You can use those different stories to decide how the current share price fits your own buy, hold, or sell logic.
For Procter & Gamble, however, we will make it really easy for you with previews of two leading Procter & Gamble Narratives:
These sit side by side so you can see how different assumptions on growth, profitability and valuation translate into very different ideas of what the shares are worth.
Fair value in this bullish narrative: about US$168.13 per share
Implied discount to fair value versus US$141.87: about 15.6% undervalued using ((168.13 - 141.87) / 168.13)
Revenue growth used in the model: about 3.12% a year
- Analysts in this camp connect steady revenue growth in the low single digits with slightly higher profit margins over time and see cash returns via dividends and buybacks supporting earnings per share.
- The narrative leans on product investment and productivity improvements to offset cost pressures, with expansion across consumer segments and value tiers feeding into gradual revenue gains.
- Using a discount rate just under 7% and a future P/E in the mid 20s, they land near a fair value of US$168.13 and view the current price as broadly in line with that story after adjusting for their assumptions.
Fair value in this cautious narrative: about US$119.81 per share
Implied premium to fair value versus US$141.87: about 18.4% overvalued using ((141.87 - 119.81) / 119.81)
Revenue growth used in the model: about 4.68% a year
- This view starts from the idea that P&G is a mature business with modest growth, so it gives more weight to cash flow and dividend models and assumes mean reversion in margins and payout ratios over time.
- Across a blend of DCF, dividend discount, historical dividend yield and historical P/E, it produces fair values mostly below the current share price, even while acknowledging the company’s long dividend track record and high returns on invested capital.
- The conclusion is that P&G looks like a high quality, income focused name, but at a price that already reflects that quality and leaves less room for upside unless margins or revenue growth come in ahead of these assumptions.
Seeing both Narratives side by side helps you decide which set of assumptions feels closer to your own view on P&G’s growth, margins and suitable P/E, and whether today’s share price lines up with that story or not.
Do you think there's more to the story for Procter & Gamble? Head over to our Community to see what others are saying!
This article by Simply Wall St is general in nature. We provide commentary based on historical data and analyst forecasts only using an unbiased methodology and our articles are not intended to be financial advice. It does not constitute a recommendation to buy or sell any stock, and does not take account of your objectives, or your financial situation. We aim to bring you long-term focused analysis driven by fundamental data. Note that our analysis may not factor in the latest price-sensitive company announcements or qualitative material. Simply Wall St has no position in any stocks mentioned.