Is It Time To Reassess Public Storage (PSA) After This Year’s 19.8% Rally?
Public Storage PSA | 0.00 |
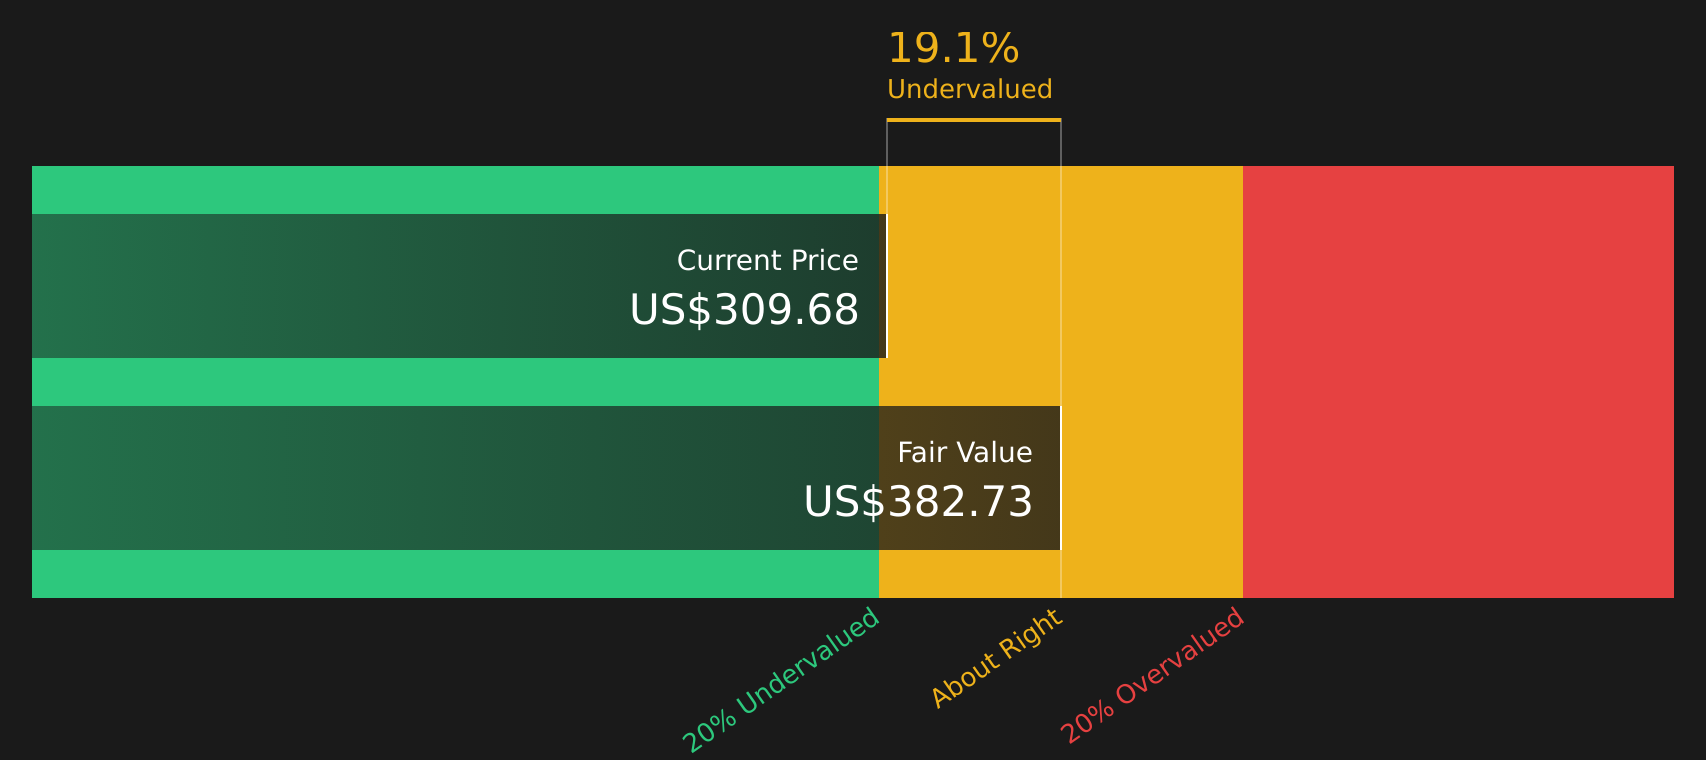
- If you are wondering whether Public Storage at about US$309.68 is priced attractively or already baking in high expectations, the starting point is to understand what the current valuation actually reflects.
- The stock has returned 2.0% over the last 7 days, 0.2% over the past month, 19.8% year to date and 6.6% over the last year. This gives you a useful backdrop before comparing the price to underlying fundamentals.
- Recent coverage has focused on Public Storage as a large U.S. self storage REIT and how investor sentiment around income focused property stocks has been shifting in response to interest rate expectations. This context helps explain why the share price performance over different time frames has drawn attention from investors assessing risk and income potential.
- Public Storage currently has a valuation score of 3/6, which means it screens as undervalued on half of the checks used here. The rest of this article will walk through those methods before finishing with a more complete way to think about what the stock could be worth.
Approach 1: Public Storage Discounted Cash Flow (DCF) Analysis
A Discounted Cash Flow model projects a company’s future adjusted funds from operations and then discounts those cash flows back to today to estimate what the business might be worth now.
For Public Storage, the latest twelve month free cash flow is about $2.78b. Analysts provide explicit projections for several years, and Simply Wall St then extrapolates further to build a 2 stage free cash flow to equity model based on adjusted funds from operations. Under this framework, projected free cash flow for 2029 is $3.07b, with intermediate and later year figures set out in the ten year projections.
Pulling those discounted cash flows together, the model arrives at an estimated intrinsic value of about $382.17 per share. Compared with the recent share price of roughly $309.68, this implies the stock screens as around 19.0% undervalued on this DCF view.
Result: UNDERVALUED
Our Discounted Cash Flow (DCF) analysis suggests Public Storage is undervalued by 19.0%. Track this in your watchlist or portfolio, or discover 49 more high quality undervalued stocks.
Approach 2: Public Storage Price vs Earnings
For profitable companies, the P/E ratio is a useful way to relate what you pay for each share to the earnings that share currently generates. A higher or lower P/E often reflects what the market is willing to pay based on its expectations for future earnings and the perceived risk of those earnings.
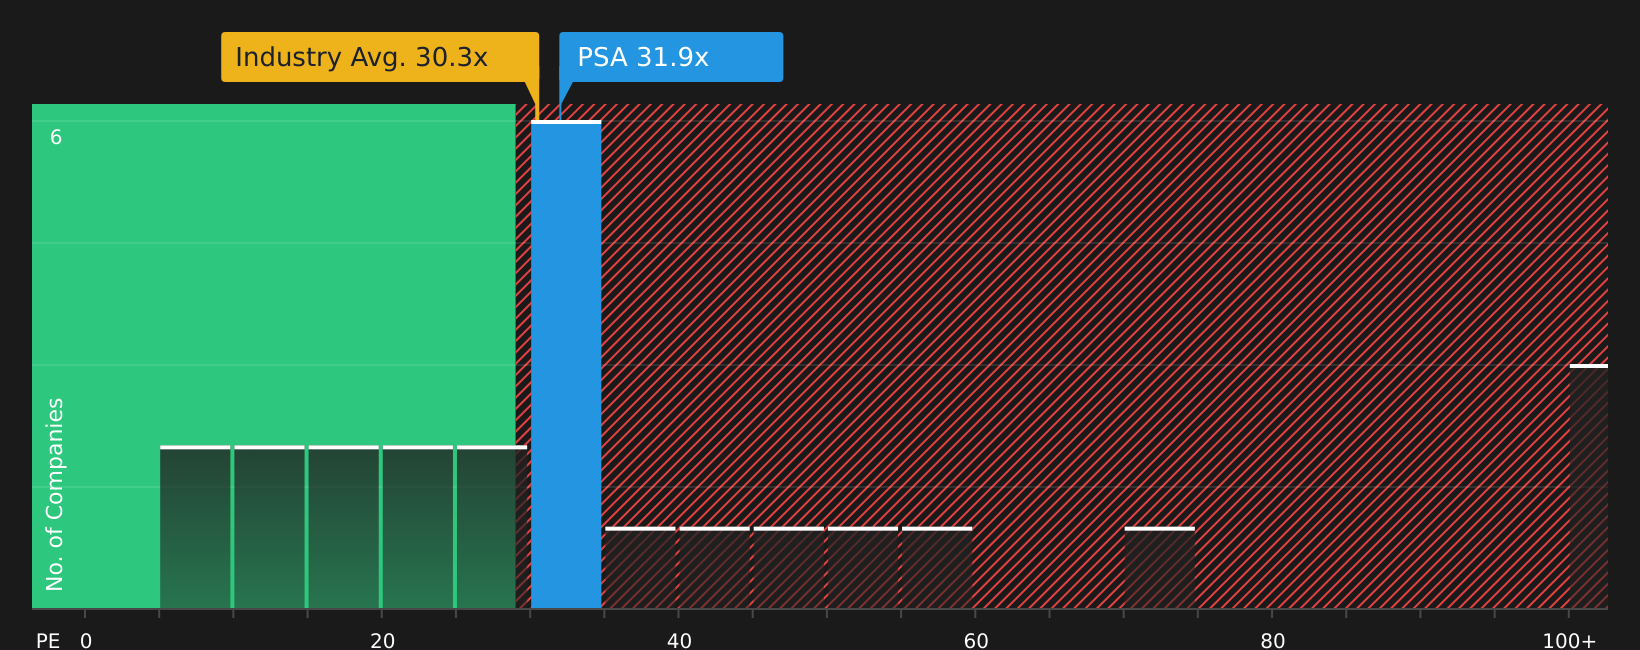
In general, stronger earnings growth and lower risk can support a higher “normal” P/E, while slower growth or higher risk usually point to a lower one. Public Storage currently trades on a P/E of 31.9x. That sits above the Specialized REITs industry average of 16.0x, but below the peer group average of 41.8x, which already shows that simple comparisons can pull you in different directions.
Simply Wall St’s Fair Ratio concept tries to resolve this by estimating what a reasonable P/E would be after adjusting for factors such as earnings growth, profit margins, industry, market cap and risk. For Public Storage, the Fair Ratio is 32.8x, slightly higher than the current 31.9x. On this framework, the stock screens as modestly undervalued relative to the Fair Ratio.
Result: UNDERVALUED
P/E ratios tell one story, but what if the real opportunity lies elsewhere? Start investing in legacies, not executives. Discover our 21 top founder-led companies.
Upgrade Your Decision Making: Choose your Public Storage Narrative
Earlier it was mentioned that there is an even better way to understand valuation. Narratives on Simply Wall St give you a clear story behind your numbers by linking your view of Public Storage’s business, your assumptions for future revenue, earnings and margins, and your fair value estimate. They then compare that to the current price in real time as news and earnings arrive, all within an easy to use Community page. Different investors can, for example, model a more optimistic scenario closer to the US$355.0 analyst target or a more cautious view nearer to US$285.0, and see how those different stories translate into different fair values and potential decision points.
Do you think there's more to the story for Public Storage? Head over to our Community to see what others are saying!

This article by Simply Wall St is general in nature. We provide commentary based on historical data and analyst forecasts only using an unbiased methodology and our articles are not intended to be financial advice. It does not constitute a recommendation to buy or sell any stock, and does not take account of your objectives, or your financial situation. We aim to bring you long-term focused analysis driven by fundamental data. Note that our analysis may not factor in the latest price-sensitive company announcements or qualitative material. Simply Wall St has no position in any stocks mentioned.