Is It Time To Reassess Redwire (RDW) After Recent Share Price Volatility?
Redwire Corp RDW | 0.00 |
- If you are wondering whether Redwire's recent swings have left the stock cheap, expensive, or somewhere in between, this article walks through what the numbers actually say about its value.
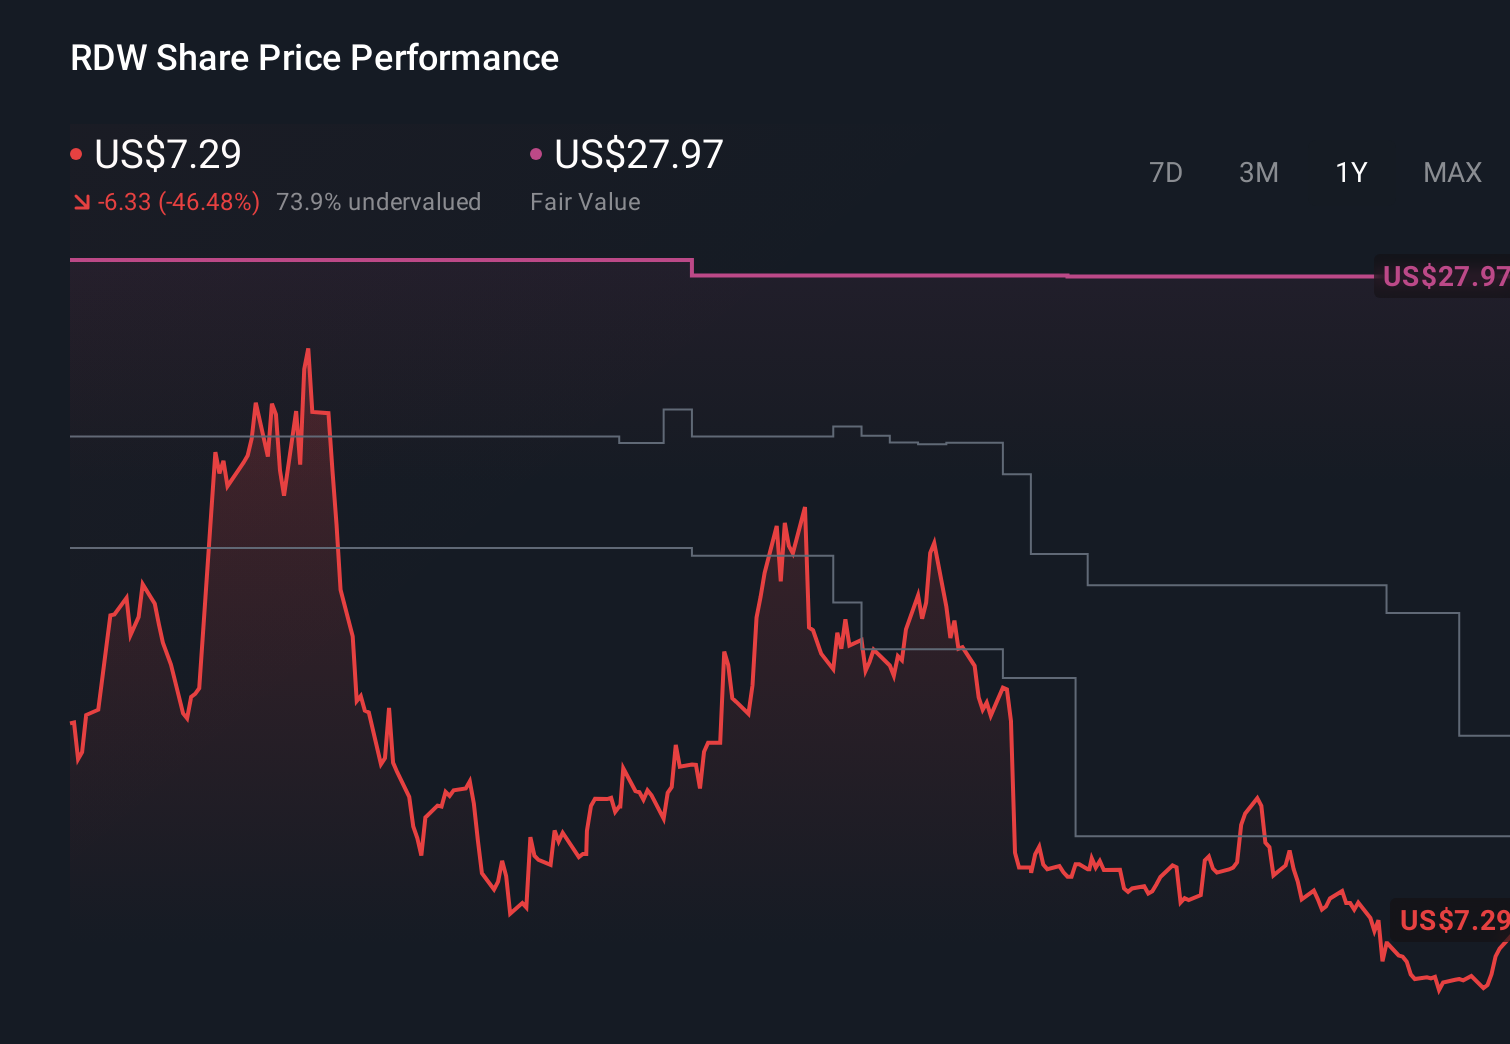
- Over the past week the share price recorded a 20.7% decline, although it is up 24.7% over the last month and 24.7% year to date, while the 1 year return sits at a 52.9% decline and the 3 year return is a very large gain compared to five years ago at 0.4%.
- Recent coverage has focused on Redwire as a space infrastructure company working on advanced engineering solutions and contracts across government and commercial space projects. This helps explain why the stock has attracted attention despite sharp price moves. This backdrop is important context when thinking about how the current share price relates to its fundamentals and long term potential.
- Right now Redwire scores 0 out of 6 on our valuation checks. In the sections that follow we will size that up using several common valuation approaches before finishing with a different way to think about what the market might be pricing in.
Redwire scores just 0/6 on our valuation checks. See what other red flags we found in the full valuation breakdown.
Approach 1: Redwire Discounted Cash Flow (DCF) Analysis
A Discounted Cash Flow, or DCF, model estimates what a company might be worth by projecting its future cash flows and then discounting those back to today to reflect risk and the time value of money.
For Redwire, the model used is a 2 Stage Free Cash Flow to Equity approach. The latest twelve month free cash flow is a loss of about $159.4 million. Analysts provide explicit forecasts up to 2027, with free cash flow for 2027 projected at $21.8 million. Beyond that, Simply Wall St extrapolates further, with ten year projections out to 2035, all still in the tens of millions of dollars.
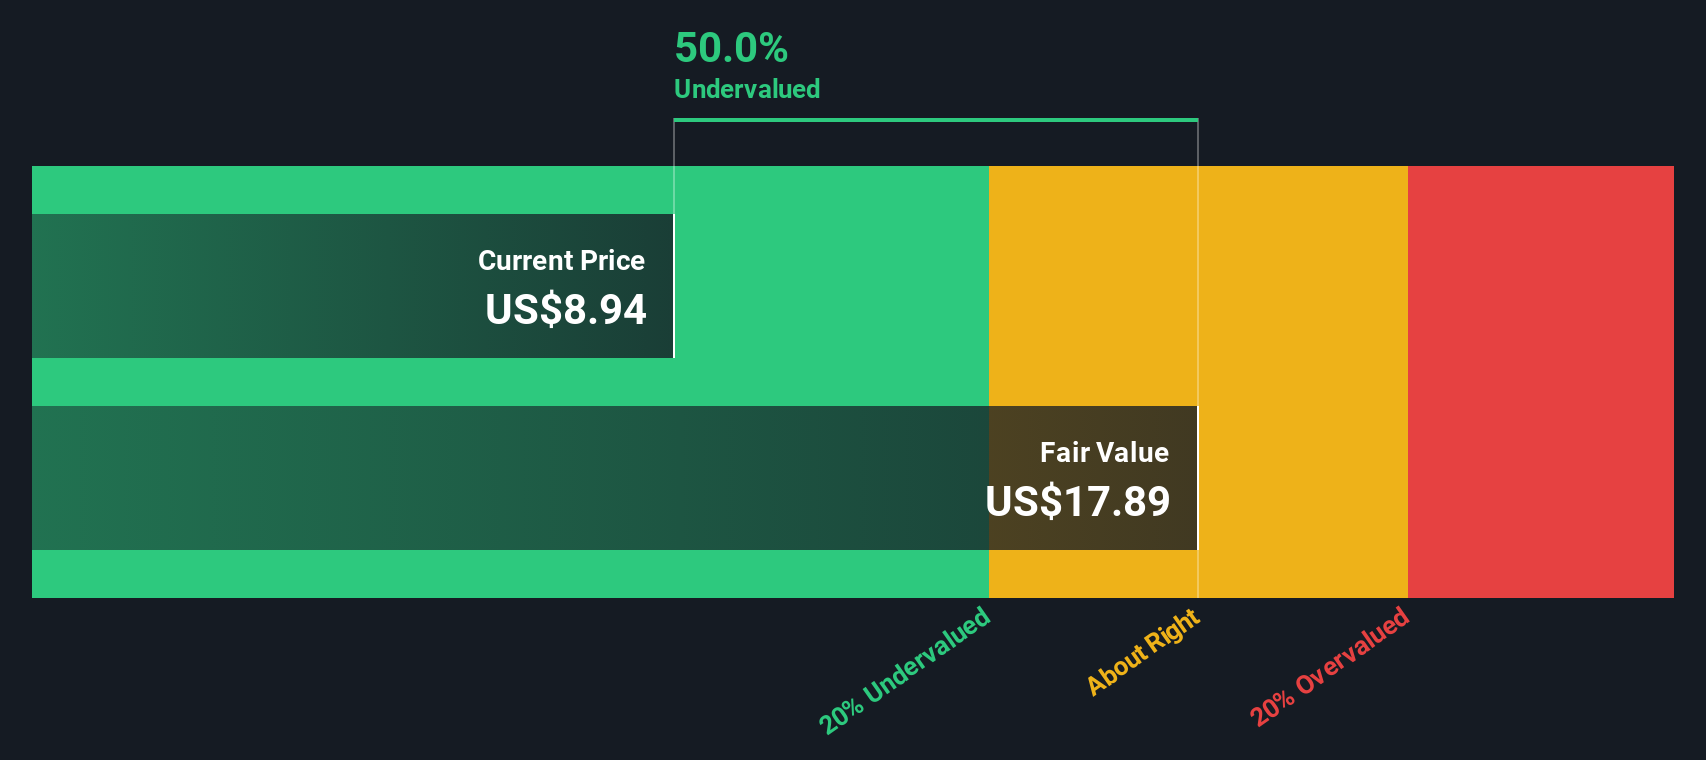
When all those projected cash flows are discounted back and combined with a terminal value, the model arrives at an estimated intrinsic value of about $2.00 per share. Compared with the current share price, this implies the stock is very expensive, with the DCF suggesting it is overvalued by about 464.2%.
Result: OVERVALUED
Our Discounted Cash Flow (DCF) analysis suggests Redwire may be overvalued by 464.2%. Discover 871 undervalued stocks or create your own screener to find better value opportunities.
Approach 2: Redwire Price vs Sales
For companies where earnings are not yet a steady guide, the P/S ratio is often a helpful way to judge what investors are paying for each dollar of revenue. It sidesteps short term noise in profits and focuses on the top line, which can be useful for earlier stage or reinvesting businesses.
In general, higher growth expectations and lower perceived risk can justify a higher P/S, while slower growth or higher risk usually point to a lower, more conservative multiple. That is why it is common to line a company up against its industry and closest peers.
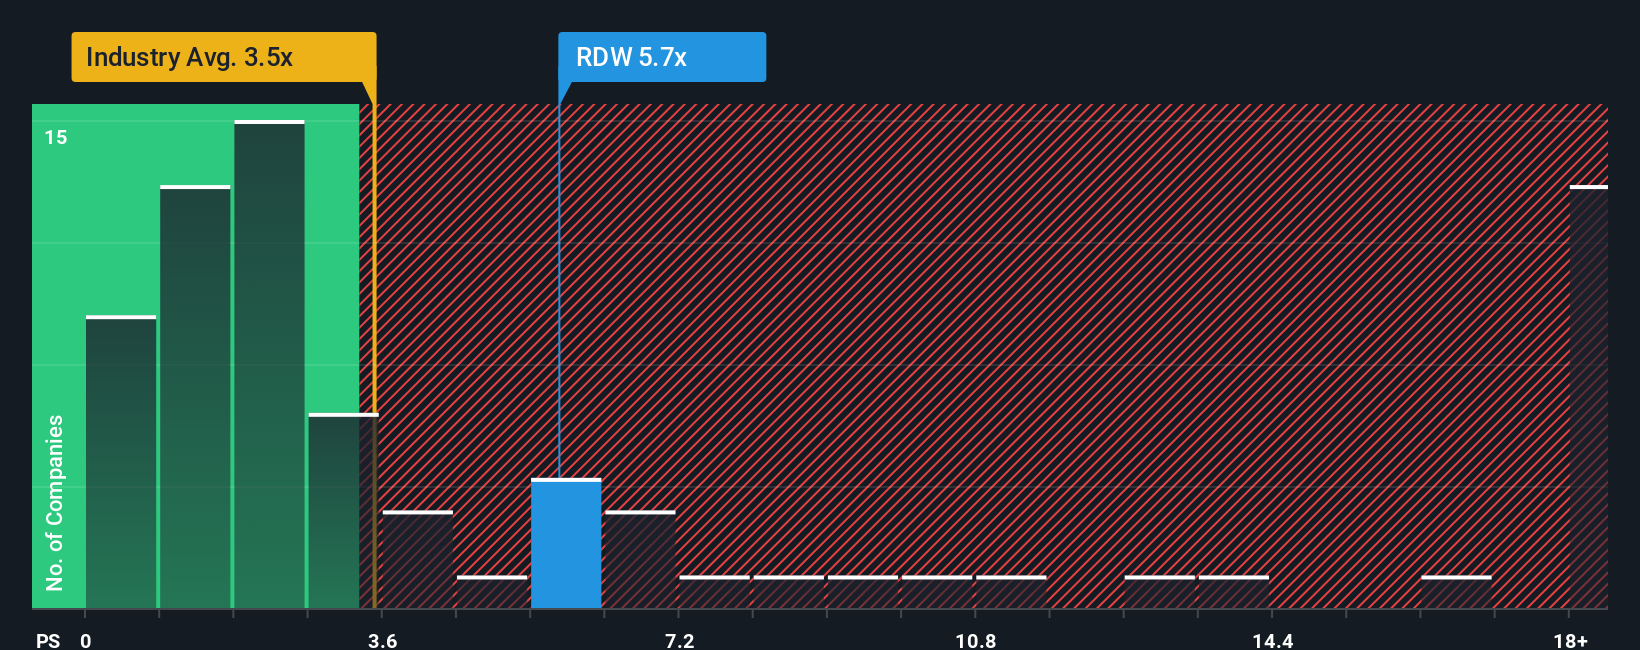
Redwire currently trades on a P/S of 6.28x. That is above the Aerospace & Defense industry average of 3.73x and also above the peer average of 2.23x. Simply Wall St also calculates a proprietary “Fair Ratio”, which is the P/S multiple it estimates for Redwire after considering earnings growth, profit margins, industry, market cap and risk. For Redwire, that Fair Ratio is 2.30x.
Because the Fair Ratio of 2.30x is well below the current 6.28x, this approach indicates that the shares look expensive on revenue.
Result: OVERVALUED
P/S ratios tell one story, but what if the real opportunity lies elsewhere? Discover 1424 companies where insiders are betting big on explosive growth.
Upgrade Your Decision Making: Choose your Redwire Narrative
Earlier we mentioned that there is an even better way to understand valuation, so let us introduce you to Narratives, which are simply your story about a company, including what you think its fair value is and how you expect its revenue, earnings and margins to play out over time.
A Narrative links all of this together, starting with Redwire’s business story, then turning that into a financial forecast, and finally into a fair value that you can compare directly with today’s share price.
On Simply Wall St, Narratives are available on the Community page and are designed to be easy to use. They can help you decide whether you think Redwire looks attractive or not by allowing you to set your own assumptions and see how your fair value compares with the current price.
Because Narratives update automatically when new information such as news or earnings is added to the platform, you can quickly see how your view of Redwire might change. For example, one investor might see Redwire as worth around US$2 per share, while another might see a far lower or higher value based on different expectations for future cash flows and margins.
Do you think there's more to the story for Redwire? Head over to our Community to see what others are saying!
This article by Simply Wall St is general in nature. We provide commentary based on historical data and analyst forecasts only using an unbiased methodology and our articles are not intended to be financial advice. It does not constitute a recommendation to buy or sell any stock, and does not take account of your objectives, or your financial situation. We aim to bring you long-term focused analysis driven by fundamental data. Note that our analysis may not factor in the latest price-sensitive company announcements or qualitative material. Simply Wall St has no position in any stocks mentioned.