Is It Time To Reassess Samsara (IOT) After Recent Share Price Slide?
Samsara, Inc. Class A IOT | 32.26 | +1.32% |
- If you are wondering whether Samsara's current share price really reflects its long term potential, you are asking the same question this article set out to tackle.
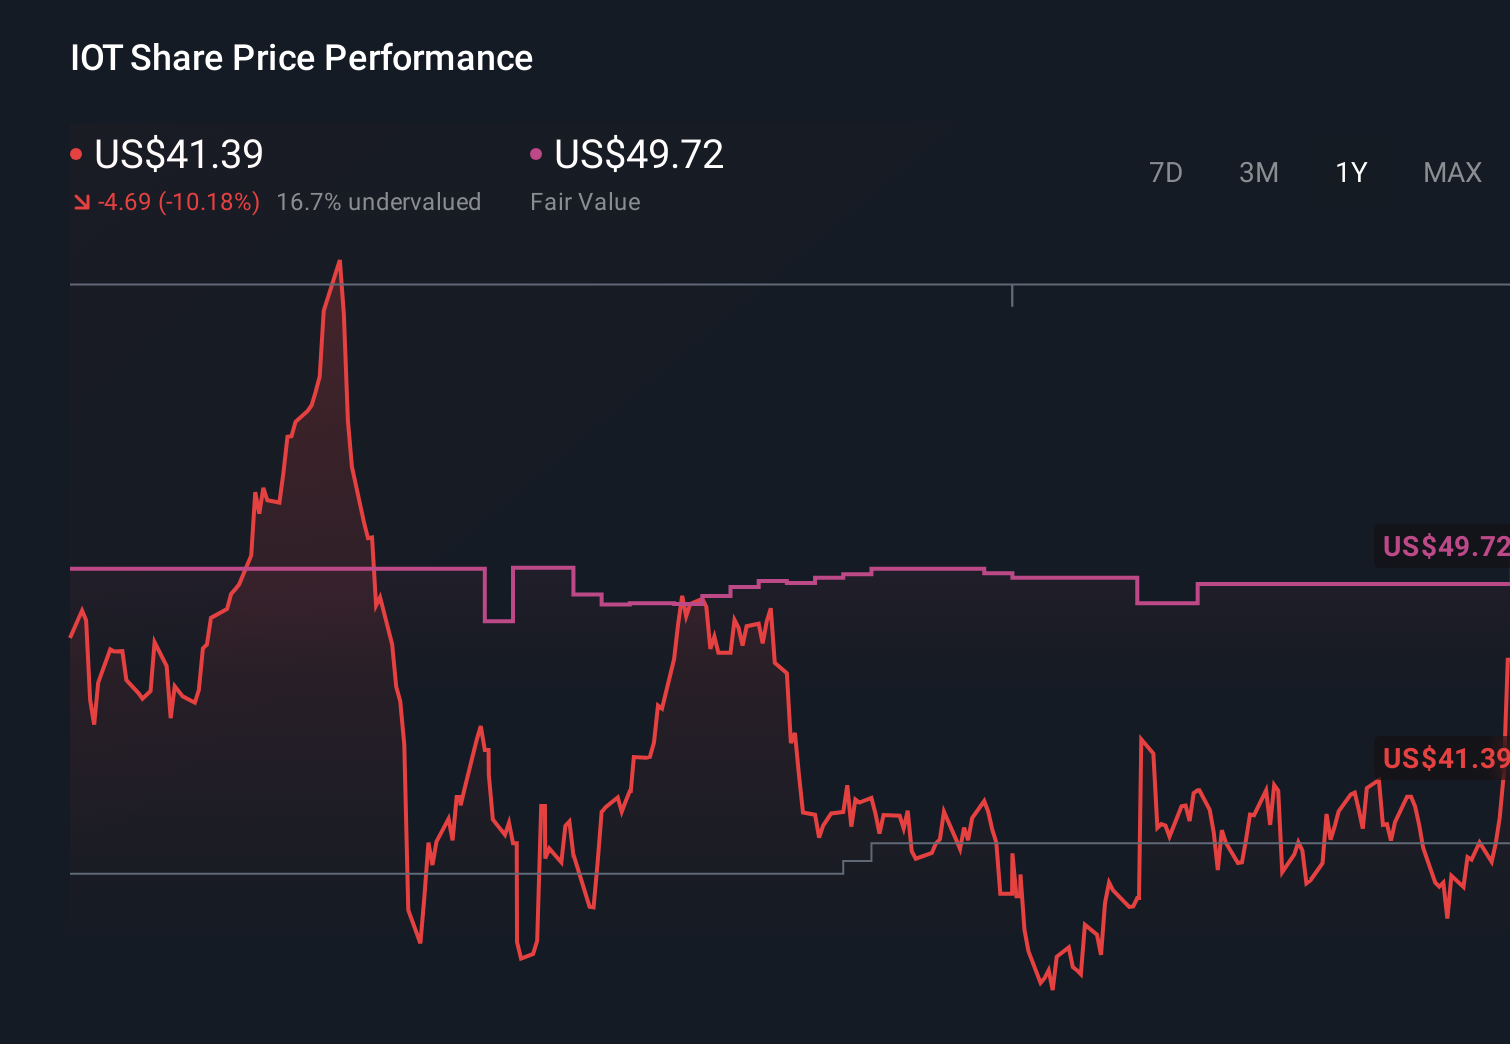
- The stock has seen a 12.6% decline over the last week, a 20.9% decline over the last month, a 17.3% decline year to date and a 45.5% decline over the last year, although the three year return sits at 90.7%.
- Recent coverage has focused on how Samsara fits into broader themes in connected operations and software as a service, with attention on its role in areas like fleet management, asset tracking and safety solutions. These updates have framed the stock as closely tied to longer term adoption trends in these technologies. This helps give context to the recent share price swings.
- Samsara currently holds a valuation score of 2 out of 6, meaning it screens as undervalued on 2 of the 6 checks we use. Next we will walk through the main valuation approaches behind that score before finishing with a different way of thinking about what value really means for this stock.
Samsara scores just 2/6 on our valuation checks. See what other red flags we found in the full valuation breakdown.
Approach 1: Samsara Discounted Cash Flow (DCF) Analysis
A Discounted Cash Flow, or DCF, model estimates what a company might be worth by projecting its future cash flows and then discounting those back to today, using the time value of money.
For Samsara, the model is a 2 Stage Free Cash Flow to Equity approach based on cash flow projections. The latest twelve month Free Cash Flow sits at about $195.6 million. Looking ahead, Simply Wall St uses analyst inputs for the next few years and then extrapolates further out, with projected Free Cash Flow of $869.9 million in 2030. All figures are in $.
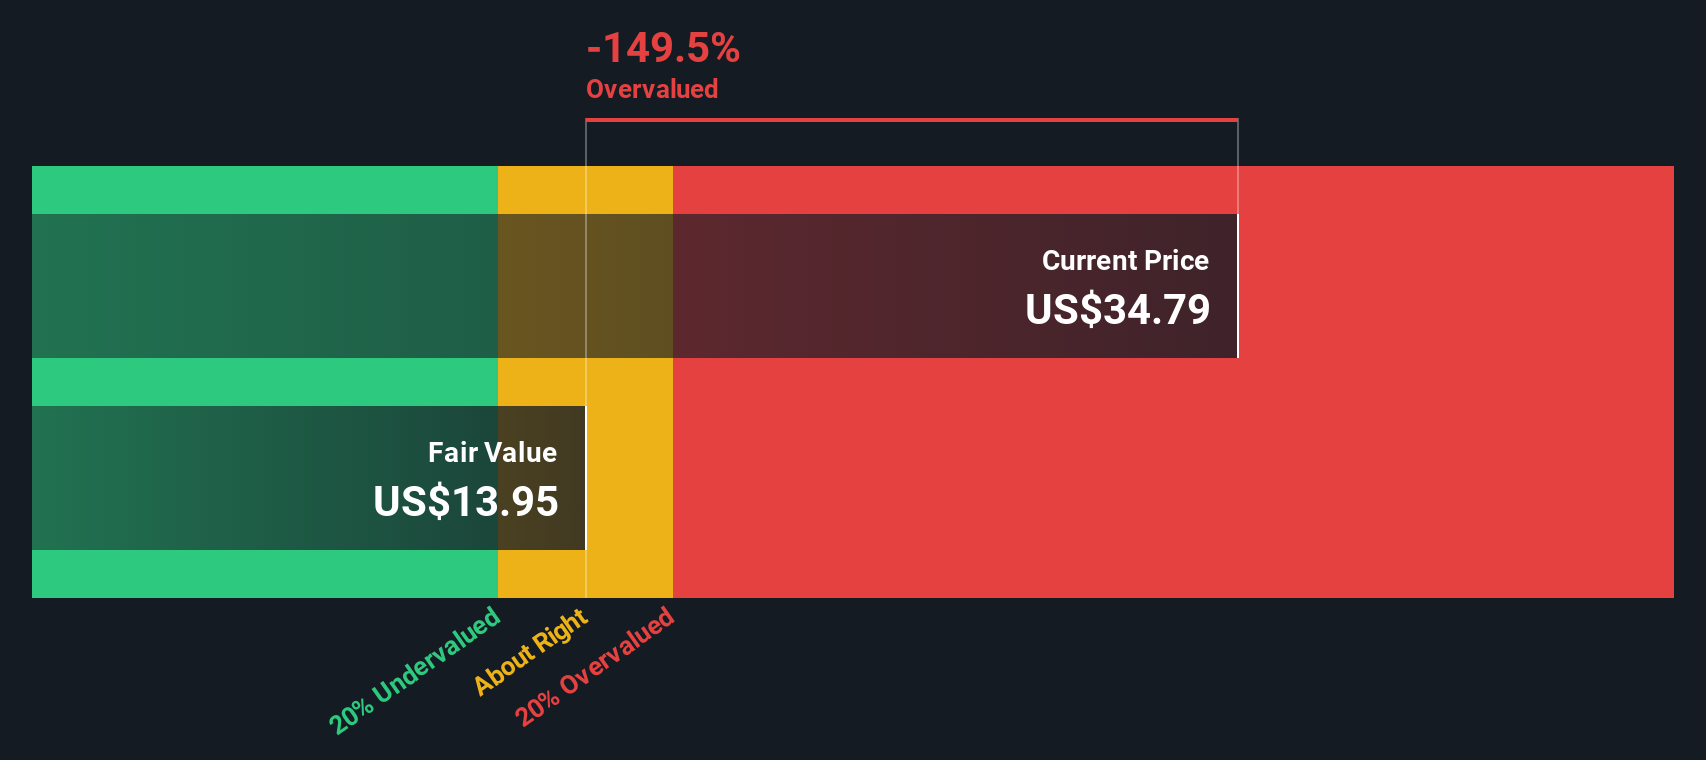
When all those projected cash flows are discounted back, the model arrives at an estimated intrinsic value of $33.80 per share. Compared to the current share price, this implies a 17.0% discount. On this DCF view, Samsara screens as undervalued.
Result: UNDERVALUED
Our Discounted Cash Flow (DCF) analysis suggests Samsara is undervalued by 17.0%. Track this in your watchlist or portfolio, or discover 868 more undervalued stocks based on cash flows.
Approach 2: Samsara Price vs Sales
For a company like Samsara that is focused on scaling revenue, the P/S ratio is a useful way to think about value because it compares what the market is paying to each dollar of sales today.
Growth expectations and risk both sit behind what investors usually see as a normal P/S multiple, with higher expected growth or stronger perceived resilience often lining up with higher ratios, and higher risk or weaker outlooks lining up with lower ones.
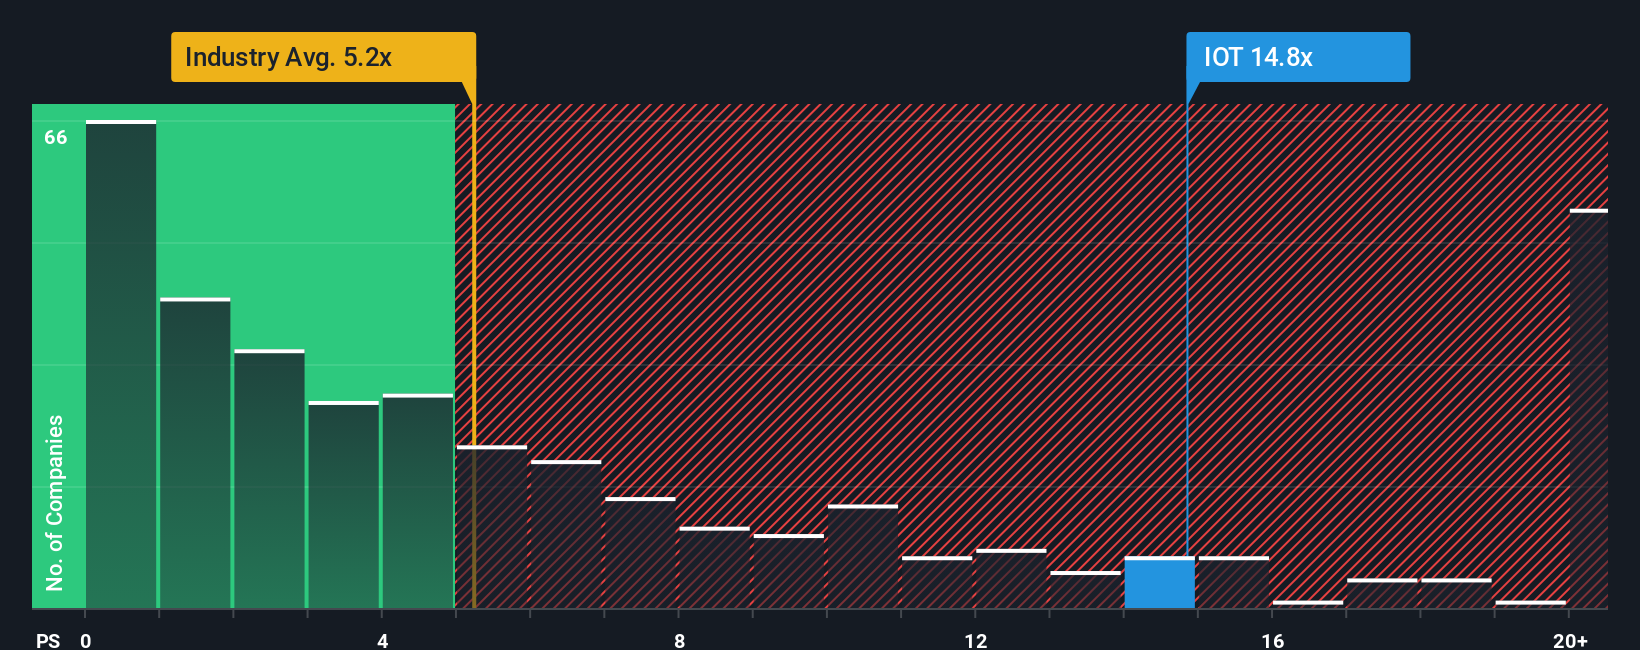
Samsara trades on a P/S of 10.64x, compared with the wider Software industry average of 4.28x and a peer average of 6.21x. Simply Wall St’s Fair Ratio for Samsara is 9.54x, which is its proprietary estimate of what the P/S might be given factors such as earnings growth, industry, profit margin, market value and company specific risks.
This Fair Ratio approach can be more useful than a simple peer or industry comparison because it adjusts for Samsara’s own characteristics rather than assuming all software names should trade on the same multiple.
Set against the Fair Ratio of 9.54x, Samsara’s current P/S of 10.64x screens as higher than what that framework implies.
Result: OVERVALUED
P/S ratios tell one story, but what if the real opportunity lies elsewhere? Discover 1417 companies where insiders are betting big on explosive growth.
Upgrade Your Decision Making: Choose your Samsara Narrative
Earlier we mentioned that there is an even better way to understand valuation, so let us introduce you to Narratives, which Simply Wall St makes available on the Community page used by millions of investors.
A Narrative is your story about Samsara, where you link what you believe about its business to concrete numbers like future revenue, earnings and margins, which then flow through to a fair value estimate.
Instead of looking at a single target price in isolation, a Narrative connects three pieces: the company story you believe, the financial forecast that follows from that story, and the fair value that drops out of those forecasts, which you can then compare with the current share price to help you decide whether to buy or sell.
Narratives on Simply Wall St are updated when new information such as earnings or news is added. It is common to see one Samsara Narrative that assumes a relatively high fair value and another that assumes a relatively low fair value, reflecting how different investors can look at the same data and reach very different conclusions.
Do you think there's more to the story for Samsara? Head over to our Community to see what others are saying!
This article by Simply Wall St is general in nature. We provide commentary based on historical data and analyst forecasts only using an unbiased methodology and our articles are not intended to be financial advice. It does not constitute a recommendation to buy or sell any stock, and does not take account of your objectives, or your financial situation. We aim to bring you long-term focused analysis driven by fundamental data. Note that our analysis may not factor in the latest price-sensitive company announcements or qualitative material. Simply Wall St has no position in any stocks mentioned.