Is It Time To Reassess Sempra (SRE) After Its Recent Share Price Climb?
Sempra SRE | 95.85 | +0.40% |
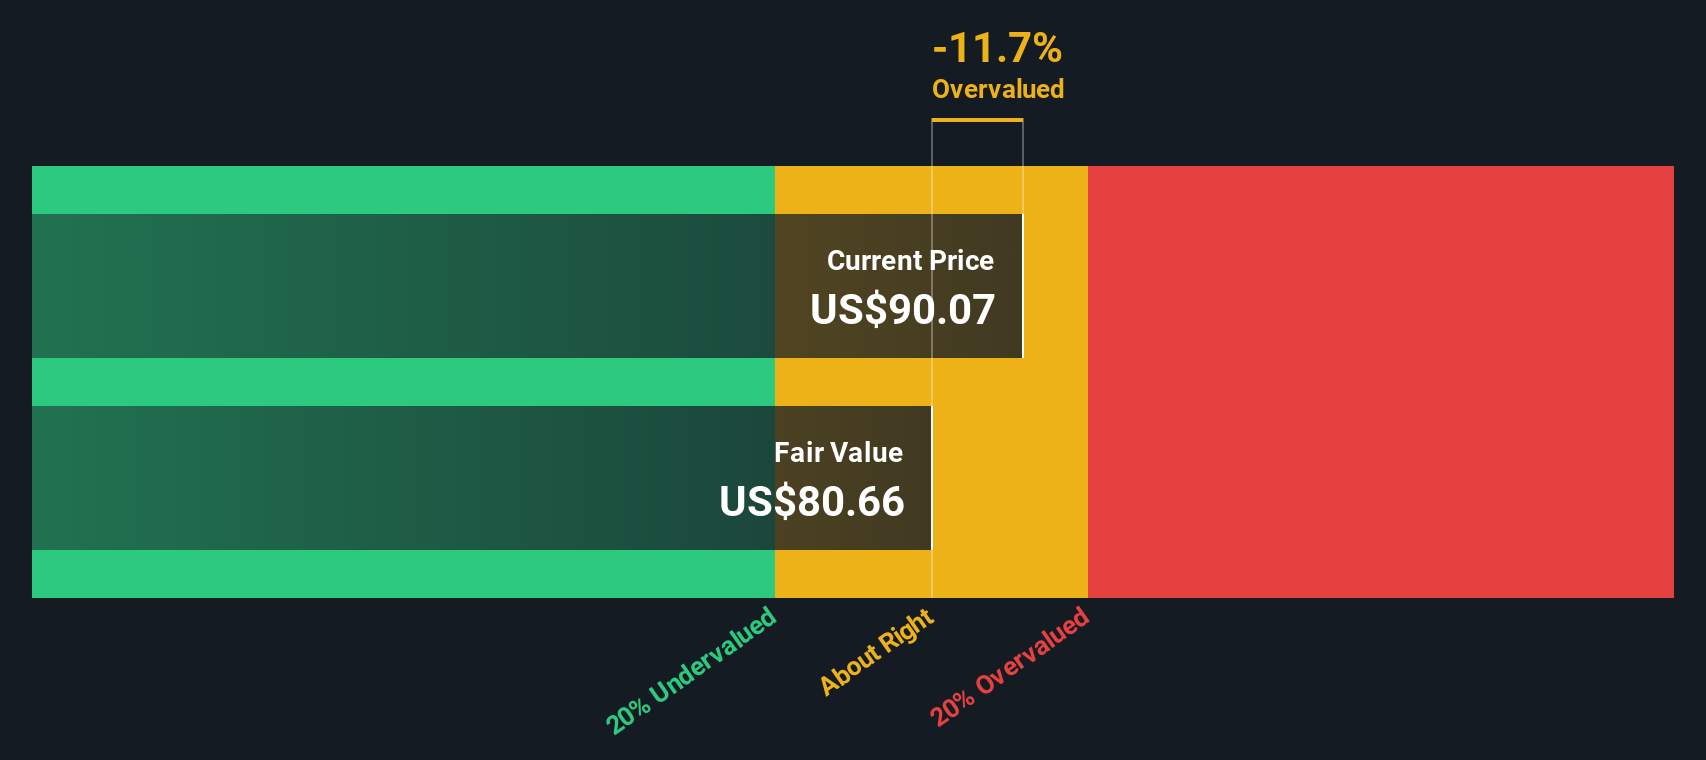
- If you are wondering whether Sempra is reasonably priced at around US$89.70 or if there is still value on the table, this article will walk you through the key clues in its current valuation.
- The stock has returned 3.1% over the last 7 days and 1.0% over the past month, while the 1 year return sits at 11.0% and the 5 year figure at 68.7%. These figures may have some investors reassessing the balance between upside and risk.
- Recent attention on Sempra has focused on its position as a large US utilities player and its ongoing role in energy infrastructure. This helps frame how the market is thinking about its stability and growth options. This context is useful when you look at the share price moves over the last year and consider whether investors are paying up for perceived reliability or something more.
- Sempra currently has a valuation score of 3/6. We will walk through what that means using common methods like discounted cash flow and multiples, then finish by looking at a more detailed way to think about valuation that ties those numbers back to the company story.
Approach 1: Sempra Discounted Cash Flow (DCF) Analysis
A Discounted Cash Flow model takes estimates of a company’s future cash flows and discounts them back to today’s dollars, aiming to show what the whole business could be worth right now.
For Sempra, the model used is a 2 Stage Free Cash Flow to Equity approach, based on cash flow projections in $. The latest twelve month free cash flow is a loss of $3.37b, so the model leans heavily on forward estimates rather than recent history. Analyst input extends to 2027, where free cash flow is projected at $6.06b. Simply Wall St then extrapolates a ten year path, reaching about $8.29b in 2035, with each year discounted back to present value.
Adding all discounted cash flows together and factoring in a terminal value gives an estimated intrinsic value of about $261.46 per share. Against a current share price around $89.70, this implies the stock trades at roughly a 65.7% discount to that DCF estimate, indicating a wide gap between modeled value and market price.
Result: UNDERVALUED
Our Discounted Cash Flow (DCF) analysis suggests Sempra is undervalued by 65.7%. Track this in your watchlist or portfolio, or discover 51 more high quality undervalued stocks.
Approach 2: Sempra Price vs Earnings
For a profitable business, the P/E ratio is a straightforward way to see what investors are paying for each dollar of earnings, which makes it a useful cross check against the DCF result you saw earlier.
What counts as a “normal” P/E depends a lot on how fast earnings are expected to grow and how risky those earnings are. Higher expected growth or lower perceived risk can support a higher P/E, while slower growth or higher uncertainty usually lines up with a lower one.
Sempra currently trades at about 27.76x earnings. That sits above the Integrated Utilities industry average of roughly 19.28x and above the peer group average of about 20.91x. Simply Wall St also provides a “Fair Ratio” for Sempra, at 28.80x, which is an estimate of what the P/E might be given factors such as its earnings profile, industry, profit margins, market value and key risks.
This Fair Ratio is designed to be more tailored than a simple peer or industry comparison because it adjusts for company specific characteristics rather than treating all utilities as the same. Sempra’s actual P/E of 27.76x is close to the Fair Ratio of 28.80x, which points to the shares being priced roughly in line with those fundamentals.
Result: ABOUT RIGHT

P/E ratios tell one story, but what if the real opportunity lies elsewhere? Start investing in legacies, not executives. Discover our 23 top founder-led companies.
Upgrade Your Decision Making: Choose your Sempra Narrative
Earlier we mentioned that there is an even better way to understand valuation, so let us introduce Narratives, a simple tool on Simply Wall St’s Community page where you connect your view of Sempra’s story with a concrete forecast for revenue, earnings and margins. You can then turn that forecast into a fair value and compare it to the current price to help inform your decision. Each Narrative updates automatically as fresh news or earnings arrive. For example, one investor might build a more optimistic Sempra view around long term EPS potential and a fair value near US$99.60, while another might focus on regulatory, LNG and climate risks and land on a much lower fair value. You can see both Narratives side by side instead of relying on a single opinion.
Do you think there's more to the story for Sempra? Head over to our Community to see what others are saying!
This article by Simply Wall St is general in nature. We provide commentary based on historical data and analyst forecasts only using an unbiased methodology and our articles are not intended to be financial advice. It does not constitute a recommendation to buy or sell any stock, and does not take account of your objectives, or your financial situation. We aim to bring you long-term focused analysis driven by fundamental data. Note that our analysis may not factor in the latest price-sensitive company announcements or qualitative material. Simply Wall St has no position in any stocks mentioned.