Is It Time To Reassess Smithfield Foods (SFD) After Recent Share Price Strength
Smithfield Foods, Inc. SFD | 28.37 | -0.80% |
- If you are wondering whether Smithfield Foods is starting to look like good value or getting a bit stretched, you are in the right place for a clear, valuation focused look at the stock.
- Smithfield Foods recently closed at US$24.57, with returns of 3.5% over 7 days, 13.1% over 30 days, 10.9% year to date and 24.2% over 1 year. This may signal that expectations and perceived risk around the stock have shifted.
- Recent company news has centered on Smithfield Foods' position in the packaged foods and protein market and how management is responding to changing consumer demand and input costs. These updates help frame whether the recent share price moves line up with the underlying business story or are more sentiment driven.
- Right now Smithfield Foods has a valuation score of 4 out of 6, which means it screens as undervalued on most of our checks. Next we will look at what different valuation approaches say about the stock and then finish with a broader way to think about value that many investors overlook.
Approach 1: Smithfield Foods Discounted Cash Flow (DCF) Analysis
A Discounted Cash Flow, or DCF, model takes the cash Smithfield Foods is expected to generate in the future and discounts those amounts back to today to estimate what the business might be worth right now.
For Smithfield Foods, the latest twelve month free cash flow sits at about $407.3 million. Analysts provide explicit estimates out to 2027, where free cash flow is projected at $735 million, and Simply Wall St then extrapolates further to build a 10 year path, with discounted annual figures ranging from about $485.1 million in 2026 to $771.9 million in 2035.
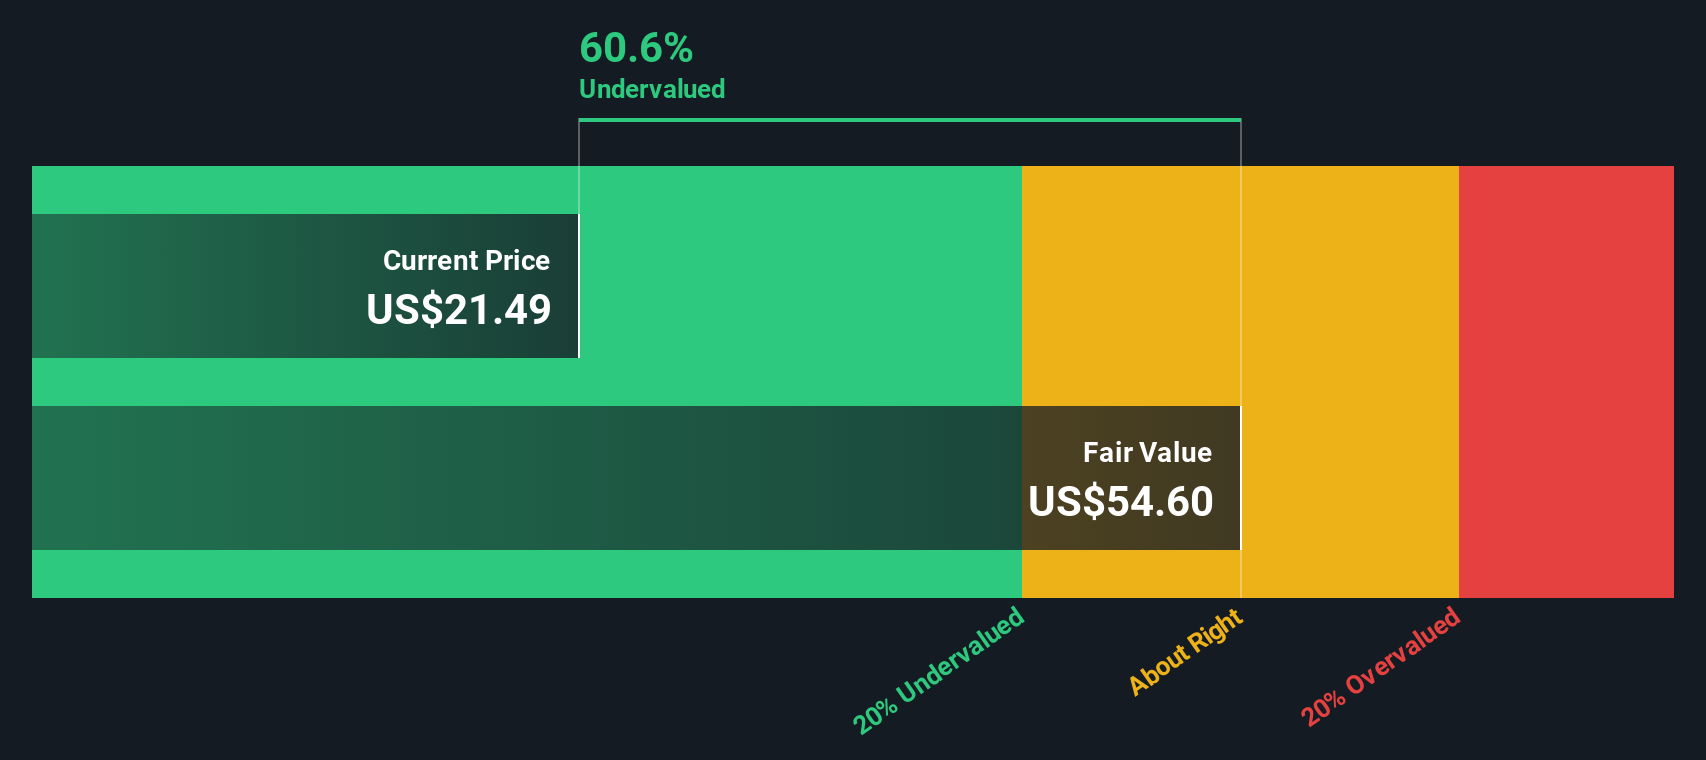
Using a 2 Stage Free Cash Flow to Equity model based on these projections, the DCF calculation points to an estimated intrinsic value of US$75.68 per share. Compared with the recent share price of US$24.57, the model suggests the stock is about 67.5% below this intrinsic value, which screens as materially undervalued on this method.
Result: UNDERVALUED
Our Discounted Cash Flow (DCF) analysis suggests Smithfield Foods is undervalued by 67.5%. Track this in your watchlist or portfolio, or discover 55 more high quality undervalued stocks.
Approach 2: Smithfield Foods Price vs Earnings
For a profitable company, the P/E ratio is a useful way to see how much investors are paying for each dollar of earnings. It ties the share price directly to current earnings, which makes it a practical cross check against the cash flow based view from the DCF.
What counts as a “normal” P/E depends on how the market views a company’s growth prospects and risk. Higher expected growth and lower perceived risk usually justify a higher P/E, while slower growth or higher risk often come with a lower multiple.
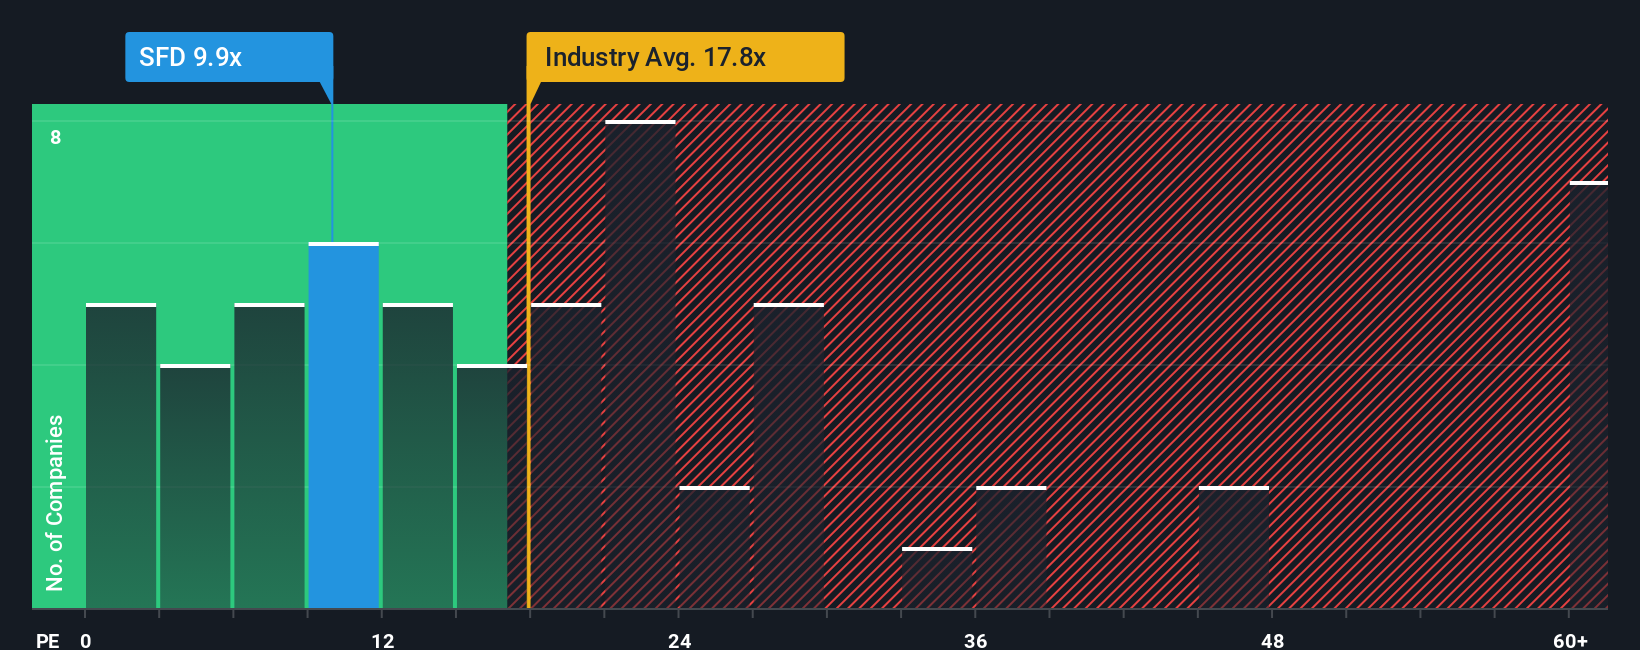
Smithfield Foods currently trades on a P/E of 11.11x. That sits below the broader Food industry average P/E of 22.90x and also below a peer group average of 17.22x. Simply Wall St also calculates a proprietary “Fair Ratio”, which is the P/E you might expect once you factor in the company’s earnings growth profile, profit margins, risk indicators, market cap and its specific industry context.
This Fair Ratio approach can be more tailored than simply lining the stock up against peers or the industry, because it adjusts for differences in quality, growth and risk instead of assuming all companies deserve similar multiples. On this framework, Smithfield Foods’ current 11.11x P/E screens as lower than the Fair Ratio, which indicates that the shares are undervalued on this method.
Result: UNDERVALUED
P/E ratios tell one story, but what if the real opportunity lies elsewhere? Start investing in legacies, not executives. Discover our 22 top founder-led companies.
Upgrade Your Decision Making: Choose your Smithfield Foods Narrative
Earlier we mentioned that there is an even better way to understand valuation, so let us introduce you to Narratives, which are simply your story about a company linked directly to the numbers you think are fair for its future revenue, earnings and margins.
Instead of only relying on a DCF or P/E screen, a Narrative asks you to spell out what you believe about Smithfield Foods, turn that into a financial forecast, then connect that forecast to a fair value that you can compare with today’s share price.
Narratives on Simply Wall St, available on the Community page used by millions of investors, are designed to be quick to set up, easy to adjust and clear enough that you can immediately see how a change in the story, such as lower input costs or different consumer demand, flows through to future cash flows and estimated value.
Because the platform refreshes Narratives when new information such as earnings or news is added, you always see a fair value that reflects your current view. This gives you a simple way to decide whether Smithfield Foods’ price looks attractive, expensive or somewhere in between at any point in time.
For example, one investor might set a Narrative that points to a much higher fair value for Smithfield Foods, while another might use more cautious assumptions that support a much lower figure. Both can clearly see how their different stories lead to different price signals.
Do you think there's more to the story for Smithfield Foods? Head over to our Community to see what others are saying!

This article by Simply Wall St is general in nature. We provide commentary based on historical data and analyst forecasts only using an unbiased methodology and our articles are not intended to be financial advice. It does not constitute a recommendation to buy or sell any stock, and does not take account of your objectives, or your financial situation. We aim to bring you long-term focused analysis driven by fundamental data. Note that our analysis may not factor in the latest price-sensitive company announcements or qualitative material. Simply Wall St has no position in any stocks mentioned.