Is It Time To Reassess SS&C Technologies (SSNC) After Recent Share Price Weakness
SS&C Technologies Holdings, Inc. SSNC | 71.36 | -0.14% |
- If you are wondering whether SS&C Technologies Holdings is starting to look interesting at its current price, this article will help you make sense of what you are really paying for.
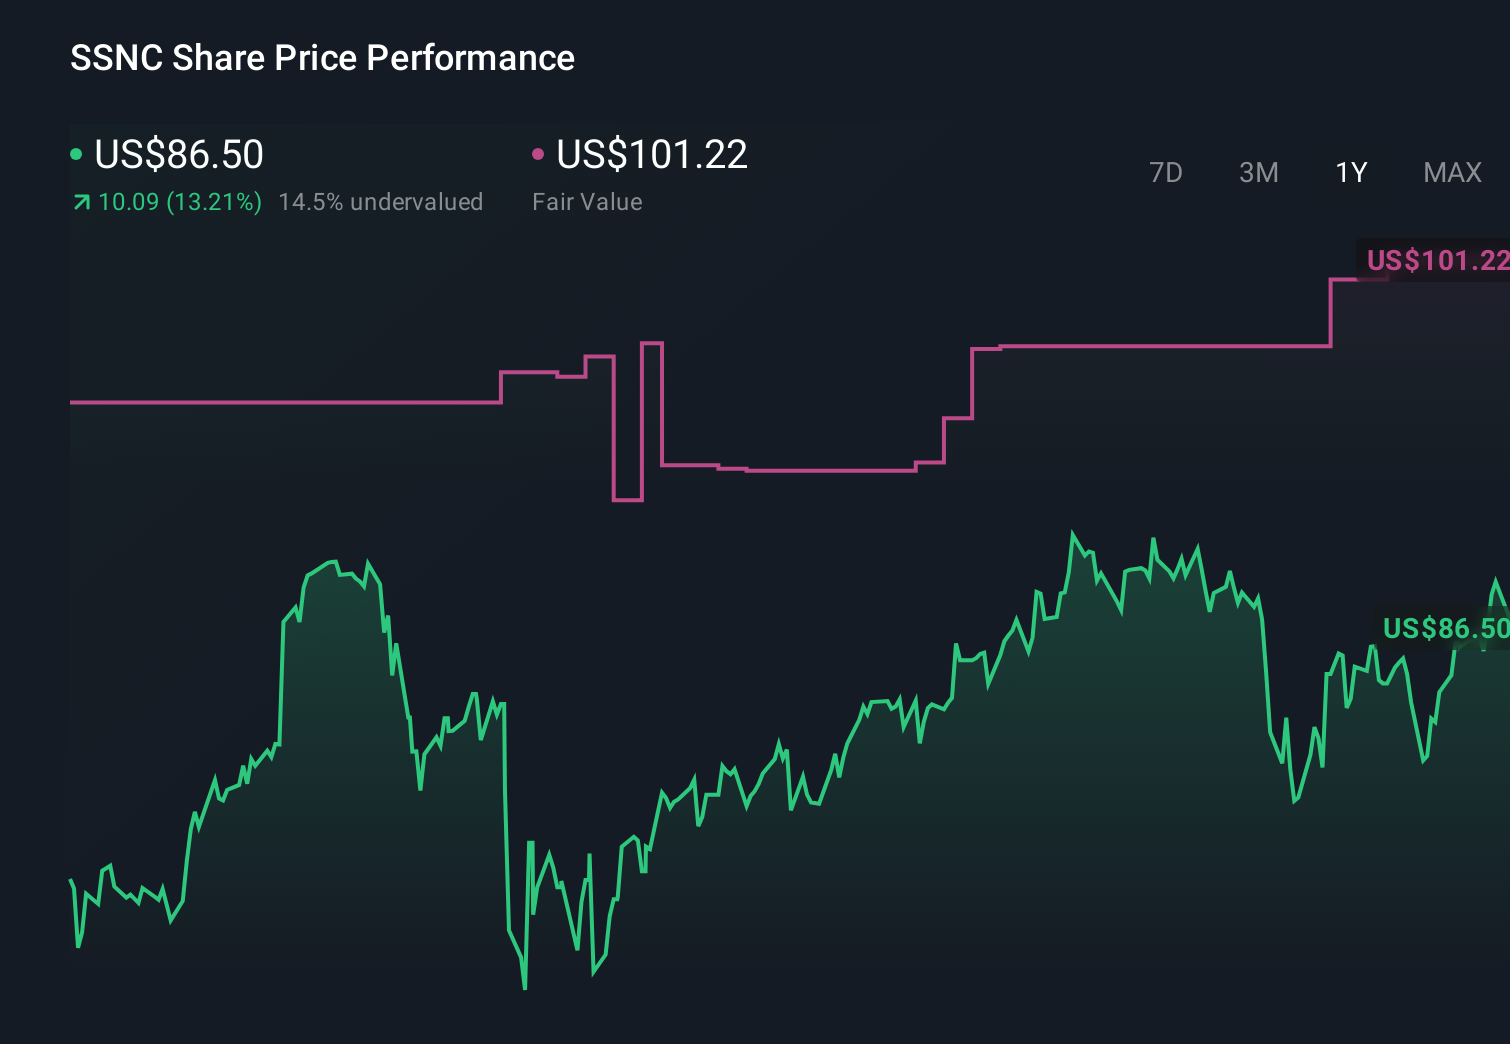
- The stock recently closed at US$72.09, with returns of a 6.8% decline over 7 days, a 16.2% decline over 30 days, a 15.9% decline year to date, and a 17.7% decline over 1 year, compared with gains of 21.8% over 3 years and 15.7% over 5 years.
- These moves sit against a backdrop of ongoing attention on SS&C's role as a software and services provider to financial and healthcare firms, with investors reacting to sector-wide trends in technology spending and outsourcing. Recent headlines have focused on how companies like SS&C fit into broader discussions about cost efficiency and operational resilience for their clients, which can influence how the market prices the stock's risk and opportunity.
- On our valuation checklist, SS&C scores 4 out of 6 for being assessed as undervalued. Next we will compare different valuation methods, and then finish by looking at one approach that can give you an even clearer read on whether the current price stacks up.
Approach 1: SS&C Technologies Holdings Discounted Cash Flow (DCF) Analysis
A DCF model takes estimates of a company’s future cash flows and discounts them back to today, to arrive at an estimate of what the business might be worth right now.
For SS&C Technologies Holdings, the latest twelve month free cash flow is about US$1.46b. Analysts and extrapolated estimates point to free cash flow of US$2.01b by 2030, with a two stage Free Cash Flow to Equity model used to extend projections out to 2035. Simply Wall St discounts each of these future cash flow estimates back to today to get a total equity value, then divides by the number of shares to get a value per share.
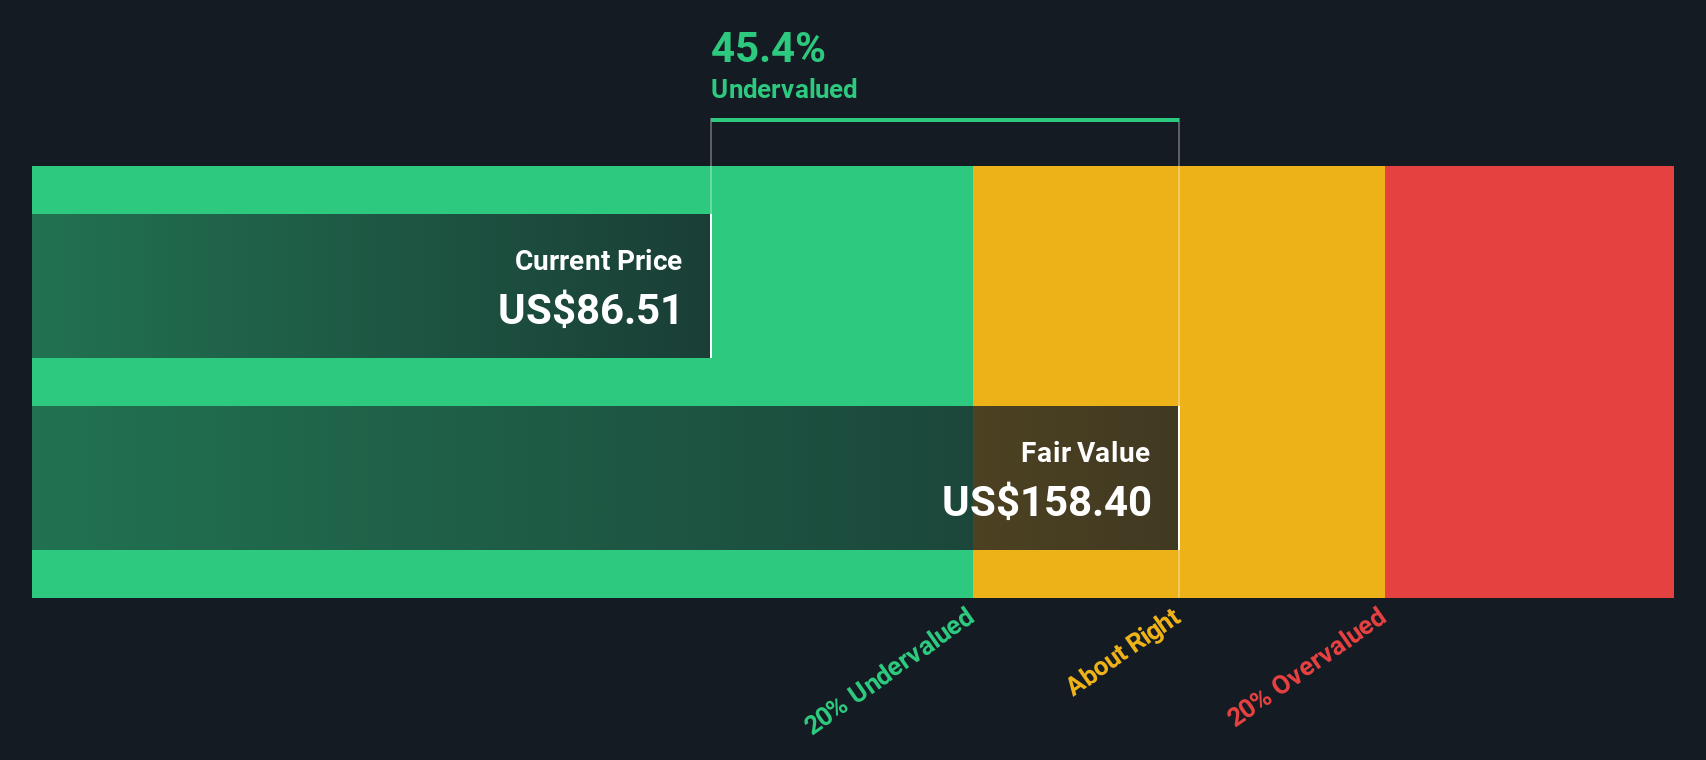
On this basis, the DCF model suggests an estimated intrinsic value of about US$159.09 per share, compared with the recent share price of US$72.09. That gap implies the shares are trading at roughly a 54.7% discount to this cash flow based estimate.
Result: UNDERVALUED
Our Discounted Cash Flow (DCF) analysis suggests SS&C Technologies Holdings is undervalued by 54.7%. Track this in your watchlist or portfolio, or discover 53 more high quality undervalued stocks.
Approach 2: SS&C Technologies Holdings Price vs Earnings
For a profitable company like SS&C Technologies Holdings, the P/E ratio is a useful shortcut because it links what you pay for the stock to the earnings the business is already generating. Investors usually accept a higher P/E when they expect stronger growth or see the earnings as relatively predictable, and a lower P/E when they see more risk or weaker growth.
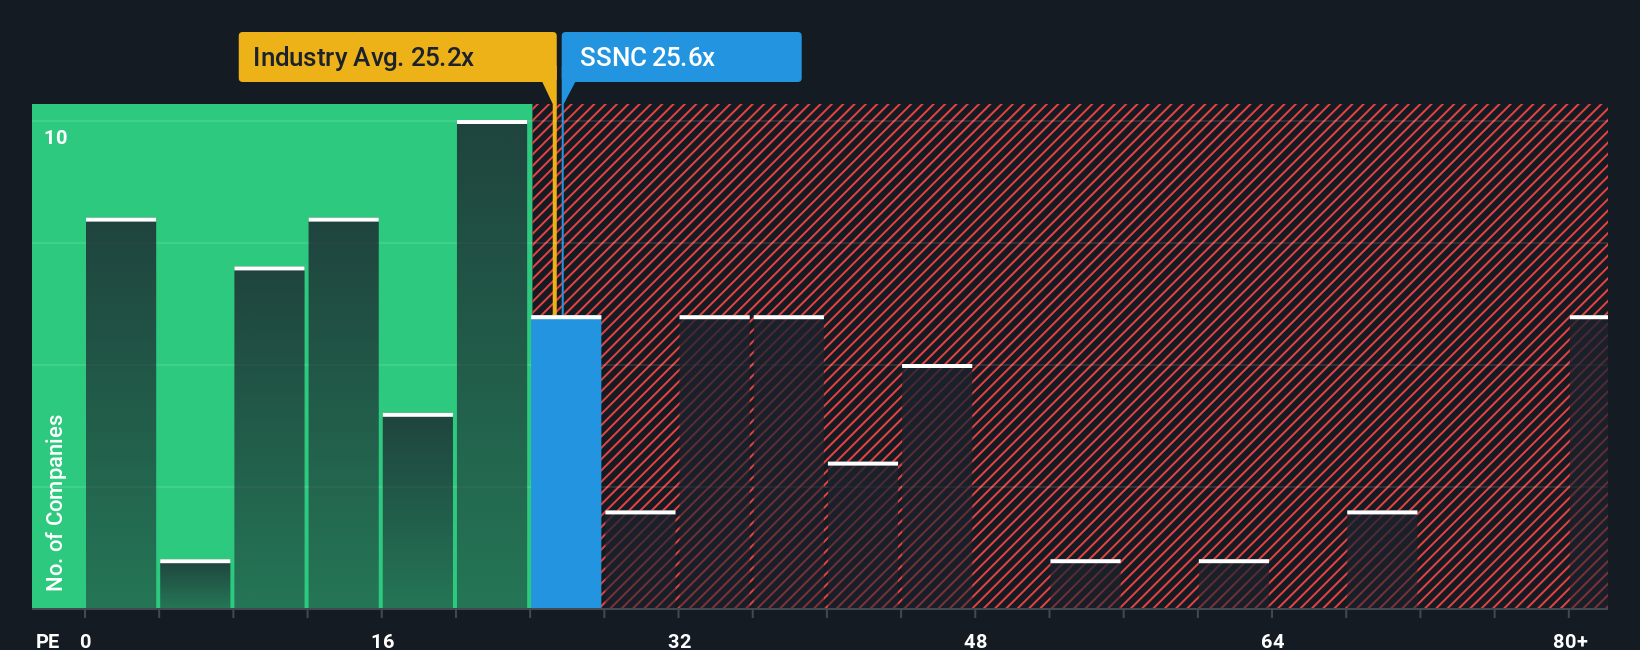
SS&C currently trades on a P/E of 22.08x. That sits above the Professional Services industry average P/E of 19.40x and the peer group average of 15.26x. Simply looking at those comparisons might make the stock look on the expensive side.
Simply Wall St’s Fair Ratio for SS&C is 27.51x. This is a proprietary estimate of what a reasonable P/E could be given the company’s earnings growth profile, industry, profit margins, market cap and risk factors. It can be more useful than simple peer or industry comparisons because it adjusts for SS&C’s own characteristics rather than assuming all companies should trade on similar multiples. With the shares on 22.08x versus a Fair Ratio of 27.51x, the stock screens as undervalued on this metric.
Result: UNDERVALUED
P/E ratios tell one story, but what if the real opportunity lies elsewhere? Start investing in legacies, not executives. Discover our 23 top founder-led companies.
Upgrade Your Decision Making: Choose your SS&C Technologies Holdings Narrative
Earlier we mentioned that there is an even better way to understand valuation. On Simply Wall St’s Community page you can use Narratives, where you set out your story for SS&C Technologies Holdings, link it to your assumptions for future revenue, earnings and margins, and get a fair value that updates as news or earnings arrive. You can then compare that fair value to today’s price to decide whether you see the stock as attractive or not. For example, one investor might build a Narrative that supports a fair value near US$110.00 based on stronger execution and expansion, while another might anchor closer to US$88.00 with more focus on risks around growth, margins and net debt.
Do you think there's more to the story for SS&C Technologies Holdings? Head over to our Community to see what others are saying!
This article by Simply Wall St is general in nature. We provide commentary based on historical data and analyst forecasts only using an unbiased methodology and our articles are not intended to be financial advice. It does not constitute a recommendation to buy or sell any stock, and does not take account of your objectives, or your financial situation. We aim to bring you long-term focused analysis driven by fundamental data. Note that our analysis may not factor in the latest price-sensitive company announcements or qualitative material. Simply Wall St has no position in any stocks mentioned.