Is It Time To Reassess Syndax Pharmaceuticals (SNDX) After A 46% One Year Share Price Gain?
Syndax Pharmaceuticals Inc SNDX | 25.15 | +5.32% |
- If you are wondering whether Syndax Pharmaceuticals at US$21.71 is offering good value today, you are not alone. This article is here to unpack that question calmly and clearly.
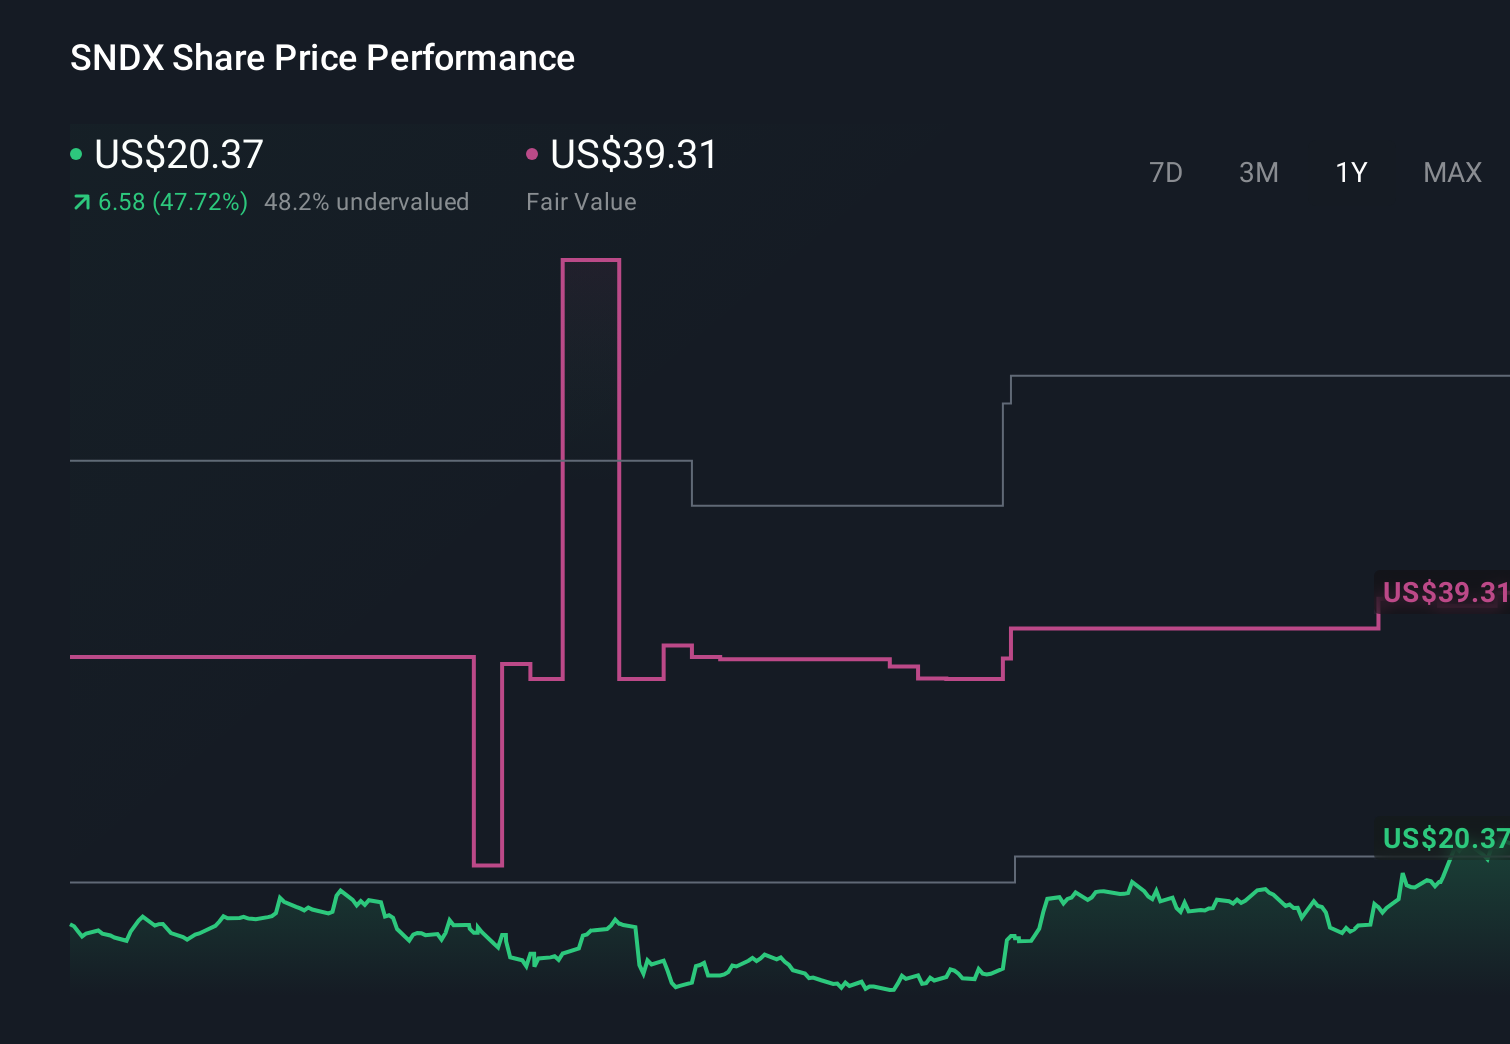
- The stock has returned 6.3% over the last 7 days, 4.8% over 30 days, 1.9% year to date and 46.1% over the past year. However, the 3 year and 5 year returns of negative 16.5% and negative 5.0% show a more mixed longer term picture.
- These moves have arrived alongside ongoing interest in Syndax Pharmaceuticals' pipeline and its position in the pharmaceuticals and biotech space. That often keeps investors focused on how future milestones could affect value. This backdrop makes it especially important to separate share price excitement from what the fundamentals might actually support.
- Simply Wall St currently gives Syndax Pharmaceuticals a valuation score of 2 out of 6. Next we will walk through what that means across different valuation approaches and then finish with a way of thinking about value that can give you an even clearer overall picture.
Syndax Pharmaceuticals scores just 2/6 on our valuation checks. See what other red flags we found in the full valuation breakdown.
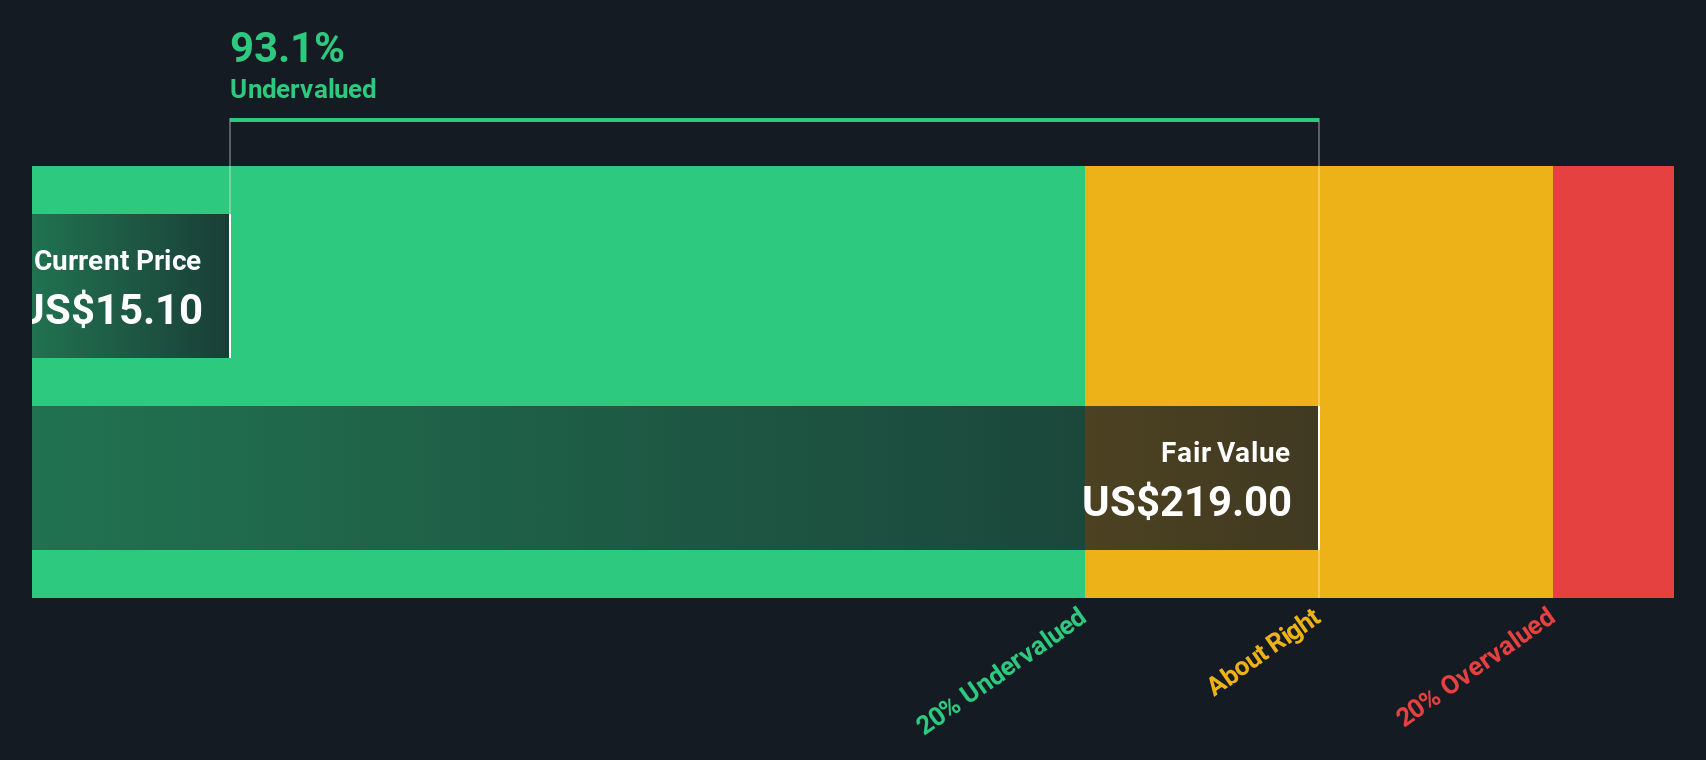
Approach 1: Syndax Pharmaceuticals Discounted Cash Flow (DCF) Analysis
A Discounted Cash Flow model takes estimates of the cash a company might generate in the future and discounts those figures back to today, aiming to arrive at an estimate of what the entire business could be worth now.
For Syndax Pharmaceuticals, the model used is a 2 Stage Free Cash Flow to Equity approach, based on cash flow projections in $. The latest twelve month free cash flow is a loss of about $311.2 million. Analysts provide explicit forecasts for the next few years, and Simply Wall St then extends those estimates further out. In this case, projected free cash flow for 2030 is about $424.8 million, with interim years gradually moving from negative to positive territory as shown in the ten year projections.
When all those future cash flows are discounted back and summed, the model arrives at an estimated intrinsic value of about $125.82 per share. Compared with the recent share price of US$21.71, this implies an intrinsic discount of roughly 82.7%, suggesting that the shares appear heavily undervalued on this model.
Result: UNDERVALUED
Our Discounted Cash Flow (DCF) analysis suggests Syndax Pharmaceuticals is undervalued by 82.7%. Track this in your watchlist or portfolio, or discover 51 more high quality undervalued stocks.
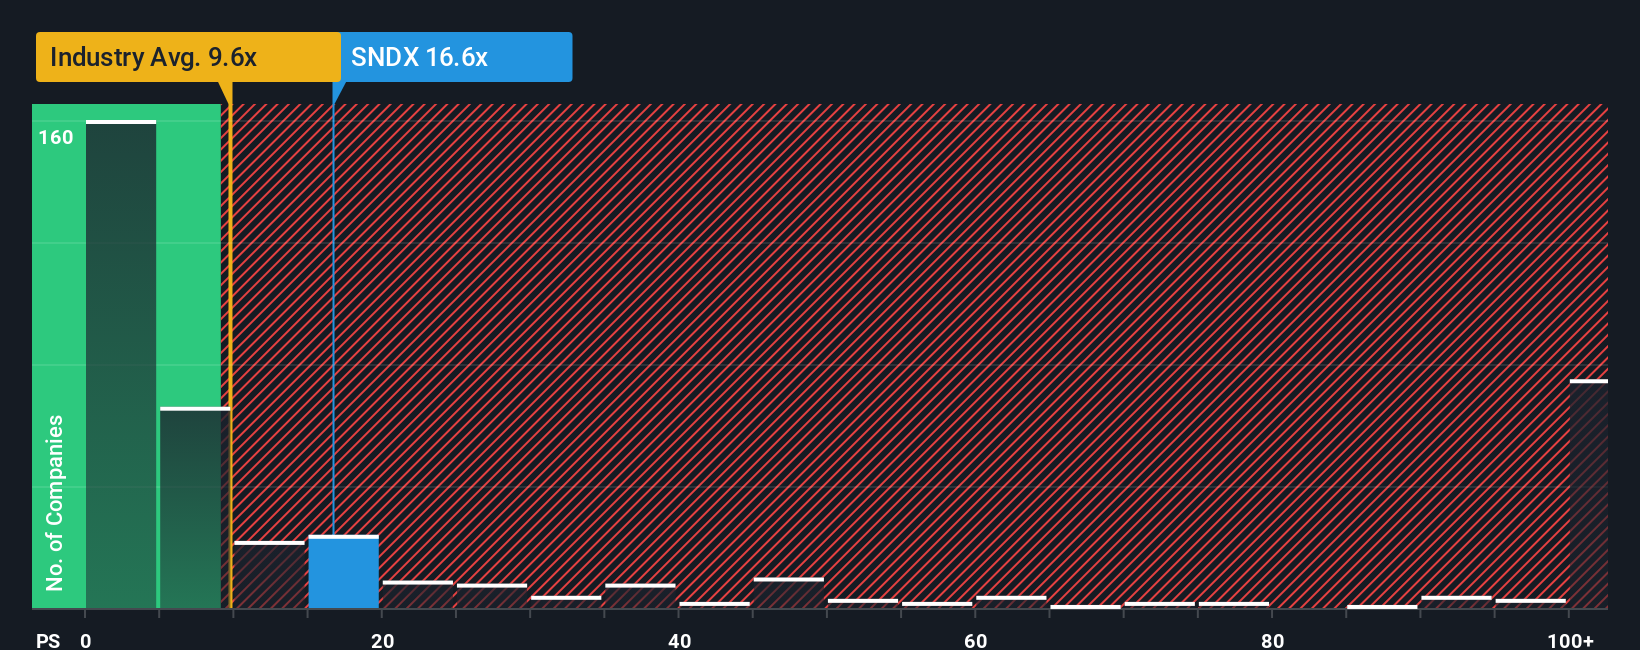
Approach 2: Syndax Pharmaceuticals Price vs Sales
For companies that are not yet profitable, the P/S ratio is often more useful than P/E because it compares the share price with current revenues rather than earnings that may still be negative. It gives you a quick sense of how much investors are paying for each dollar of sales.
What counts as a “normal” P/S ratio usually reflects what investors think about the company’s growth potential and risk profile. Higher expected growth and lower perceived risk tend to support a higher P/S, while slower growth or higher uncertainty often come with a lower multiple.
Syndax Pharmaceuticals currently trades on a P/S of 16.95x, compared with the Biotechs industry average of about 11.64x and a peer average of 11.71x. Simply Wall St’s proprietary Fair Ratio for Syndax is 1.04x. The Fair Ratio is designed to be a more tailored benchmark than a simple peer or industry comparison because it factors in elements such as growth expectations, risks, profit margins, market cap and the company’s industry.
With the actual P/S of 16.95x well above the Fair Ratio of 1.04x, this framework suggests the shares are trading on a richer multiple than those fundamentals would typically support.
Result: OVERVALUED
P/S ratios tell one story, but what if the real opportunity lies elsewhere? Start investing in legacies, not executives. Discover our 22 top founder-led companies.
Upgrade Your Decision Making: Choose your Syndax Pharmaceuticals Narrative
Earlier we mentioned that there is an even better way to understand valuation, so let us introduce you to Narratives, a simple tool on Simply Wall St’s Community page that lets you set out your own story for Syndax Pharmaceuticals. You can connect that story to specific forecasts for revenue, earnings and margins, and translate it into a Fair Value you can compare with the current share price. The tool updates automatically as new news or earnings arrive. One investor might build a cautious Syndax Narrative closer to the US$19 lowest analyst target, while another takes a more optimistic view nearer the US$56 high target, and both can clearly see how their assumptions lead to very different conclusions about whether the shares look expensive or cheap to them.
Do you think there's more to the story for Syndax Pharmaceuticals? Head over to our Community to see what others are saying!
This article by Simply Wall St is general in nature. We provide commentary based on historical data and analyst forecasts only using an unbiased methodology and our articles are not intended to be financial advice. It does not constitute a recommendation to buy or sell any stock, and does not take account of your objectives, or your financial situation. We aim to bring you long-term focused analysis driven by fundamental data. Note that our analysis may not factor in the latest price-sensitive company announcements or qualitative material. Simply Wall St has no position in any stocks mentioned.