Is It Time To Reassess T. Rowe Price (TROW) After Recent Share Price Weakness?
T. Rowe Price Group, Inc. TROW | 95.84 | +1.56% |
- If you are looking at T. Rowe Price Group and wondering whether the current share price reflects fair value, this article will walk through that question step by step.
- The stock last closed at US$92.06, with returns of 12.2% decline over 7 days, 15.5% decline over 30 days, 12.0% decline year to date, 13.0% decline over 1 year, 9.5% decline over 3 years, and 29.8% decline over 5 years, which may influence how you think about both risk and potential opportunity.
- Recent news around asset managers and capital markets has kept investor attention on how fee based businesses respond to changing client activity and sentiment. For T. Rowe Price Group, this backdrop helps frame the recent share price moves as part of a broader conversation about long term asset gathering and profitability rather than a single short term event.
- On our checks, T. Rowe Price Group scores a 5 out of 6 valuation rating, reflecting where it screens as potentially undervalued. Next, we will walk through the standard valuation approaches investors often use before finishing with a more complete way to think about what the stock could be worth.
Approach 1: T. Rowe Price Group Excess Returns Analysis
The Excess Returns model looks at how much value a company can create over and above the return that shareholders require, based on its equity base and profitability. For T. Rowe Price Group, the starting point is a Book Value of $49.68 per share and a Stable EPS estimate of $9.12 per share, sourced from weighted future Return on Equity estimates from 4 analysts.
The model applies a Cost of Equity of $3.80 per share and compares this with an Excess Return of $5.32 per share. That excess reflects an Average Return on Equity of 18.82% on a Stable Book Value of $48.46 per share, based on future Book Value estimates from 2 analysts. In simple terms, the company is modeled as earning more on its equity than investors are assumed to require, which feeds into its intrinsic value estimate.
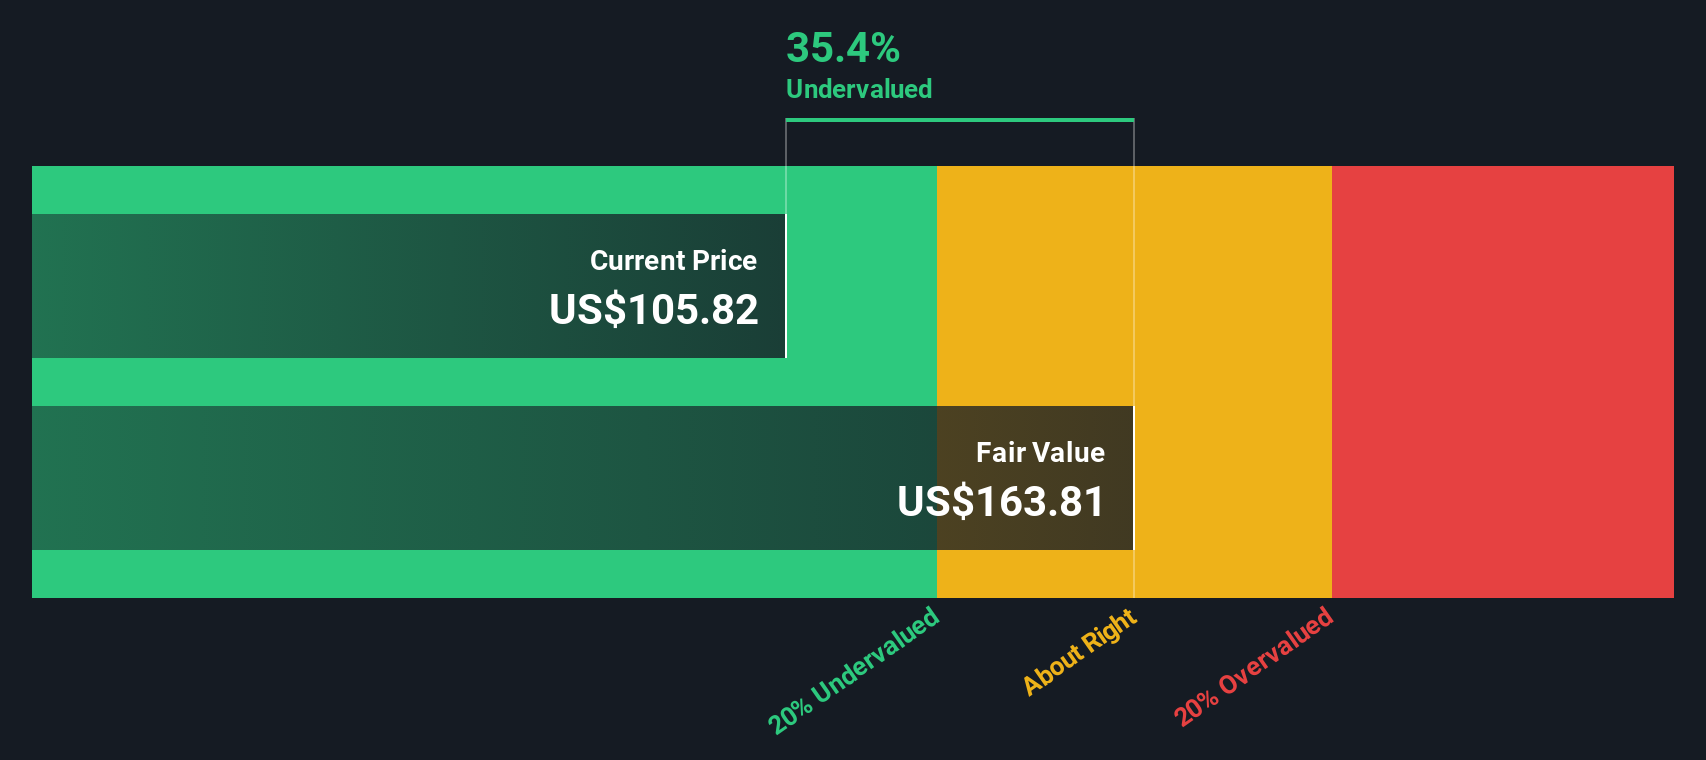
On these inputs, the Excess Returns approach points to an intrinsic value of about $168.31 per share. Compared with the recent share price of $92.06, this suggests the stock screens as materially undervalued, with an intrinsic discount of 45.3%.
Result: UNDERVALUED
Our Excess Returns analysis suggests T. Rowe Price Group is undervalued by 45.3%. Track this in your watchlist or portfolio, or discover 55 more high quality undervalued stocks.
Approach 2: T. Rowe Price Group Price vs Earnings
For a profitable business like T. Rowe Price Group, the P/E ratio is a straightforward way to link what you pay today to the earnings the company is already generating. It gives you a quick sense of how many dollars investors are willing to pay for each dollar of earnings.
What counts as a "normal" P/E comes down to expectations and risk. Higher expected earnings growth or more resilient profits can justify a higher multiple, while higher uncertainty or weaker profitability often point to a lower one.
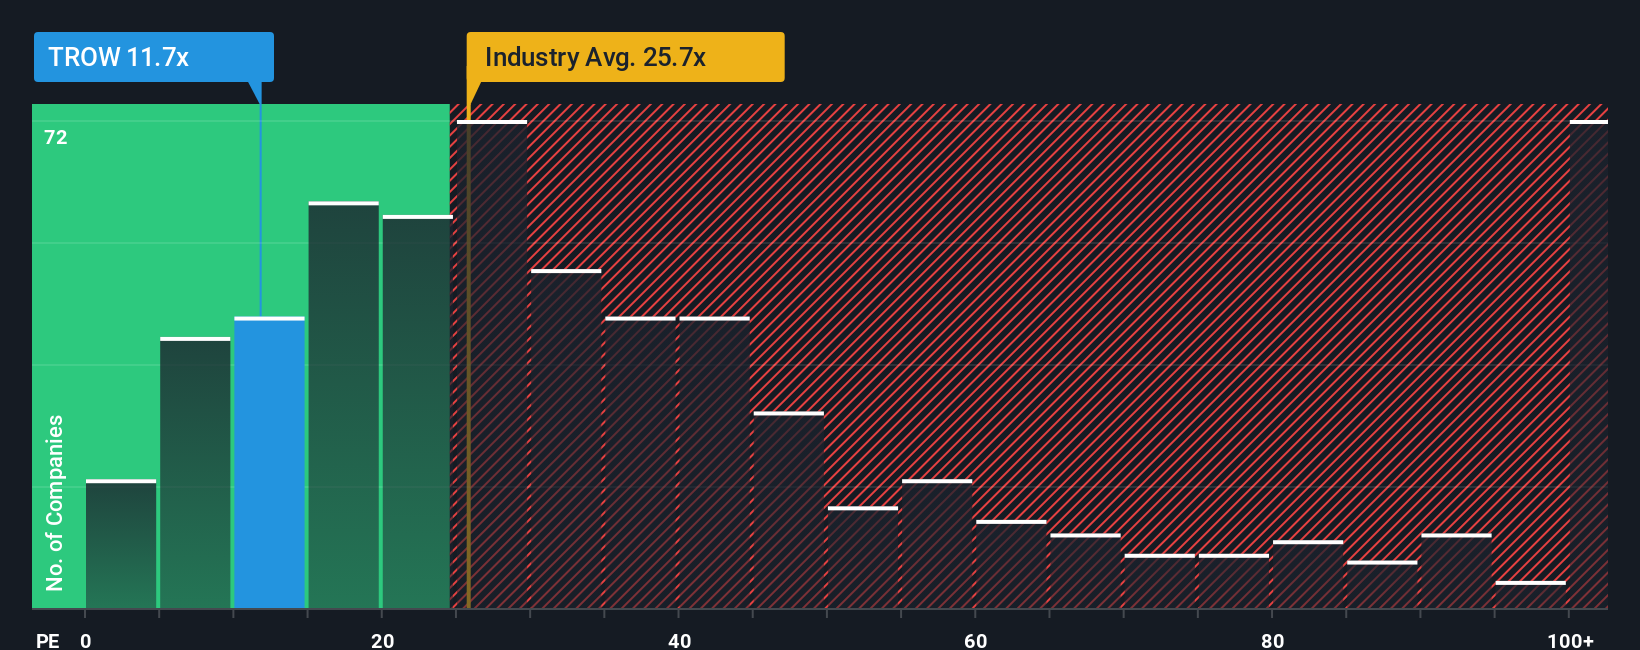
T. Rowe Price Group currently trades on a P/E of 9.88x. That is below the Capital Markets industry average P/E of 22.79x and the peer average of 52.18x. Simply Wall St also calculates a proprietary Fair Ratio of 15.75x for T. Rowe Price Group, which is the P/E level suggested after considering factors like earnings growth, profit margins, industry, market cap and key risks.
This Fair Ratio can be more useful than a simple peer or industry comparison because it is tailored to the company rather than assuming all firms in the sector deserve the same multiple. Against this Fair Ratio, the current 9.88x P/E is lower, which indicates that the shares may be undervalued on this metric.
Result: UNDERVALUED
P/E ratios tell one story, but what if the real opportunity lies elsewhere? Start investing in legacies, not executives. Discover our 22 top founder-led companies.
Upgrade Your Decision Making: Choose your T. Rowe Price Group Narrative
Earlier we mentioned that there is an even better way to understand valuation, so let us introduce you to Narratives, which let you attach a clear story to the numbers you are using for T. Rowe Price Group.
A Narrative is simply your view of the company written into its assumptions, such as what you think is a fair value, how revenue, earnings and profit margins might develop, and what return you want for taking on the risk.
On Simply Wall St, used by millions of investors, Narratives sit on the Community page and link that story to an explicit financial forecast and then to a fair value estimate that you can compare with today’s share price.
This helps you decide if the gap between Fair Value and Price looks sufficiently large to consider different portfolio actions, such as buying, trimming, or doing nothing. Because Narratives are updated when fresh information like news or earnings arrives, your view can adjust as the facts change.
For T. Rowe Price Group, one Narrative might assume a relatively cautious fair value and modest revenue expectations, while another could use a higher fair value with stronger revenue and margin assumptions. Both are clearly laid out so you can see exactly where you agree or disagree.
Do you think there's more to the story for T. Rowe Price Group? Head over to our Community to see what others are saying!

This article by Simply Wall St is general in nature. We provide commentary based on historical data and analyst forecasts only using an unbiased methodology and our articles are not intended to be financial advice. It does not constitute a recommendation to buy or sell any stock, and does not take account of your objectives, or your financial situation. We aim to bring you long-term focused analysis driven by fundamental data. Note that our analysis may not factor in the latest price-sensitive company announcements or qualitative material. Simply Wall St has no position in any stocks mentioned.