Is It Time To Reassess Talos Energy (TALO) After A 113% One Year Share Price Jump
Talos Energy, Inc. TALO | 0.00 |
- If you are wondering whether Talos Energy's share price still offers value, the starting point is to understand how its current market price lines up with several common valuation checks.
- The stock recently closed at US$15.56, with returns of 4.4% over the past week, a 0.6% decline over the past month, 38.3% year to date and 112.6% over the past year.
- Recent news flow around Talos Energy has focused on broader coverage of the company in investor research platforms, which often increases attention on how fairly the shares are priced. That context helps explain why more investors are starting to pay closer attention to both the upside case and the risks.
- Talos Energy currently has a valuation score of 5 out of 6. Next you will see how different valuation approaches arrive at that figure and how a more complete framework at the end of the article can help you make better sense of what that means for you.
Approach 1: Talos Energy Discounted Cash Flow (DCF) Analysis
A Discounted Cash Flow model estimates what a company could be worth by projecting its future cash flows and then discounting those back to today’s value using a required rate of return.
For Talos Energy, the model used is a 2 Stage Free Cash Flow to Equity approach, based on cash flows in $. The latest twelve month free cash flow is about $405.3 million. Analysts provide explicit free cash flow estimates out to 2030, with a projection of $246 million for that year, and Simply Wall St extrapolates additional years to complete the 10 year path.
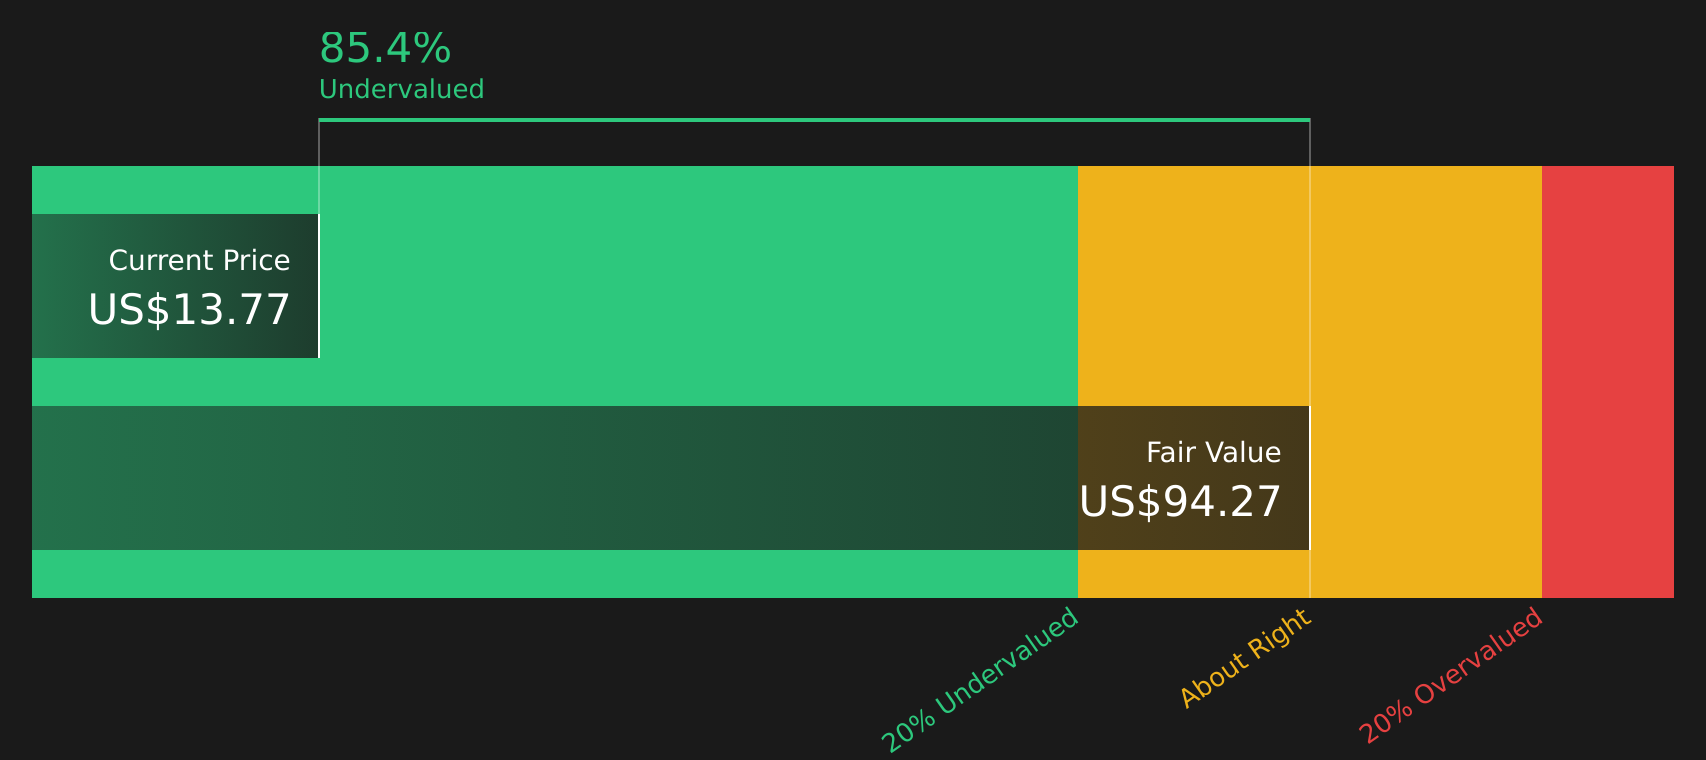
Each of these projected cash flows is discounted to reflect time and risk. When these discounted values are added together and adjusted for equity, the model arrives at an estimated intrinsic value of US$28.71 per share.
Compared with the recent share price of US$15.56, this suggests the stock trades at a 45.8% discount to the DCF estimate, which indicates Talos Energy may be undervalued on this measure alone.
Result: UNDERVALUED
Our Discounted Cash Flow (DCF) analysis suggests Talos Energy is undervalued by 45.8%. Track this in your watchlist or portfolio, or discover 50 more high quality undervalued stocks.
Approach 2: Talos Energy Price vs Sales
The preferred metric here is the Price to Sales ratio, which is often useful when you want to compare companies on how the market values each dollar of revenue, especially when earnings can be volatile. A higher P/S ratio usually reflects higher growth expectations or lower perceived risk, while a lower P/S ratio can point to more cautious expectations.
Talos Energy currently trades on a P/S ratio of 1.47x. That sits below the Oil and Gas industry average P/S of 2.13x and also below the peer group average of 2.36x. Simply Wall St goes a step further with its proprietary Fair Ratio, which estimates what a more suitable P/S might be based on factors such as earnings growth, profit margins, industry, market capitalization and risk. For Talos Energy, this Fair Ratio is 2.41x.
Because the Fair Ratio is tailored to the company, it can be more informative than a simple industry or peer comparison, which treats very different businesses as if they were the same. Comparing the Fair Ratio of 2.41x with the current P/S of 1.47x suggests Talos Energy shares are trading below this model based benchmark.
Result: UNDERVALUED

P/S ratios tell one story, but what if the real opportunity lies elsewhere? Start investing in legacies, not executives. Discover our 17 top founder-led companies.
Upgrade Your Decision Making: Choose your Talos Energy Narrative
Earlier it was mentioned that there is an even better way to understand valuation, so meet Narratives, which let you attach a clear story about Talos Energy to specific assumptions for future revenue, earnings, margins and a fair value, then compare that fair value with the current share price to decide whether the stock looks attractive or expensive.
A Narrative is simply your view of how the business might develop, translated into numbers in a forecast, which makes it easier to see whether your expectations line up with what the market is currently pricing in.
On Simply Wall St, Narratives sit inside the Community page, where millions of investors can quickly build or review these story plus numbers combinations without needing to build full models from scratch.
Each Narrative updates when new information such as Talos Energy earnings, production news, impairments or guidance is added, so your fair value estimate does not stay frozen while the facts move.
For example, one Talos Energy Narrative might lean toward the higher fair value of US$22.00 with assumptions closer to the more optimistic analysts, while another might anchor around the lower US$14.00 view, and seeing both side by side can help you decide which story you find more realistic before you act on the price.
For Talos Energy however we will make it really easy for you with previews of two leading Talos Energy Narratives:
Start by looking at how a bullish and a bearish analyst frame the same set of facts around cash flows, drilling plans, carbon capture projects, and balance sheet commitments, then decide which feels closer to your own expectations.
Both narratives use explicit assumptions for revenue growth, margins, capital allocation and discount rates, so you can see exactly what needs to happen to justify each fair value, rather than relying only on a single headline target.
Fair value: US$22.00 per share
Implied discount to fair value versus the recent US$15.56 share price: about 29.3% undervalued
Revenue growth assumption: about 5.35% a year
- Analysts in this camp describe Talos Energy as expanding margins and free cash flow as operational initiatives and cost discipline flow through, with potential support from an active 2026 drilling program and portfolio expansion in the Gulf of Mexico.
- They also include upside from carbon capture, utilization and storage projects and possible acquisitions, which together could add new revenue streams and support higher long term earnings and cash generation if execution stays on track.
- To reach the US$22.00 fair value by around 2029, this view uses assumptions of revenue of about US$2.1b, earnings of about US$420.7m and a P/E of roughly 9.1x, all discounted back at about 7%, while acknowledging risks tied to regulation, decommissioning costs, offshore operations and ESG pressure.
Fair value: US$14.00 per share
Implied premium to fair value versus the recent US$15.56 share price: about 11.1% overvalued
Revenue growth assumption: about 3.31% annual decline
- This view focuses on Talos Energy's concentration in Gulf of Mexico offshore assets, where weather, regulation and decommissioning obligations are treated as factors that could weigh on production stability, earnings and cash flows over time.
- It also treats carbon capture and acquisition led growth as slower to contribute, given regulatory, technical and integration hurdles, while ongoing capital expenditure and abandonment costs may limit flexibility if oil prices are weaker.
- To support a US$14.00 fair value by around 2029, this narrative assumes revenues of about US$1.6b, earnings of about US$300.9m and a P/E of roughly 8.1x on those earnings, discounted at about 7%, with the current price sitting modestly above that implied value.
Whichever side you lean toward, the key is to test these assumptions against your own view on Talos Energy's production profile, capital plans and risk tolerance, rather than anchoring only on the current share price.
To see how these bullish and bearish cases sit alongside other views, and to track when the story changes, it can help to review the full set of narratives and valuation work around Talos Energy in one place, then decide how or whether it fits your portfolio.
To see how these results tie into long-term growth, risks, and valuation, check out the full range of community narratives for Talos Energy on Simply Wall St. Add the company to your watchlist or portfolio so you'll be alerted when the story evolves.
Do you think there's more to the story for Talos Energy? Head over to our Community to see what others are saying!

This article by Simply Wall St is general in nature. We provide commentary based on historical data and analyst forecasts only using an unbiased methodology and our articles are not intended to be financial advice. It does not constitute a recommendation to buy or sell any stock, and does not take account of your objectives, or your financial situation. We aim to bring you long-term focused analysis driven by fundamental data. Note that our analysis may not factor in the latest price-sensitive company announcements or qualitative material. Simply Wall St has no position in any stocks mentioned.