Is It Time To Reassess Texas Pacific Land (TPL) After Its Recent Share Price Rebound
Texas Pacific Land Corporation TPL | 444.24 | +1.15% |
- Wondering whether Texas Pacific Land is priced fairly at around US$345.78, or if the current share price is out of step with its fundamentals? This article will focus squarely on what you are getting for the price you pay.
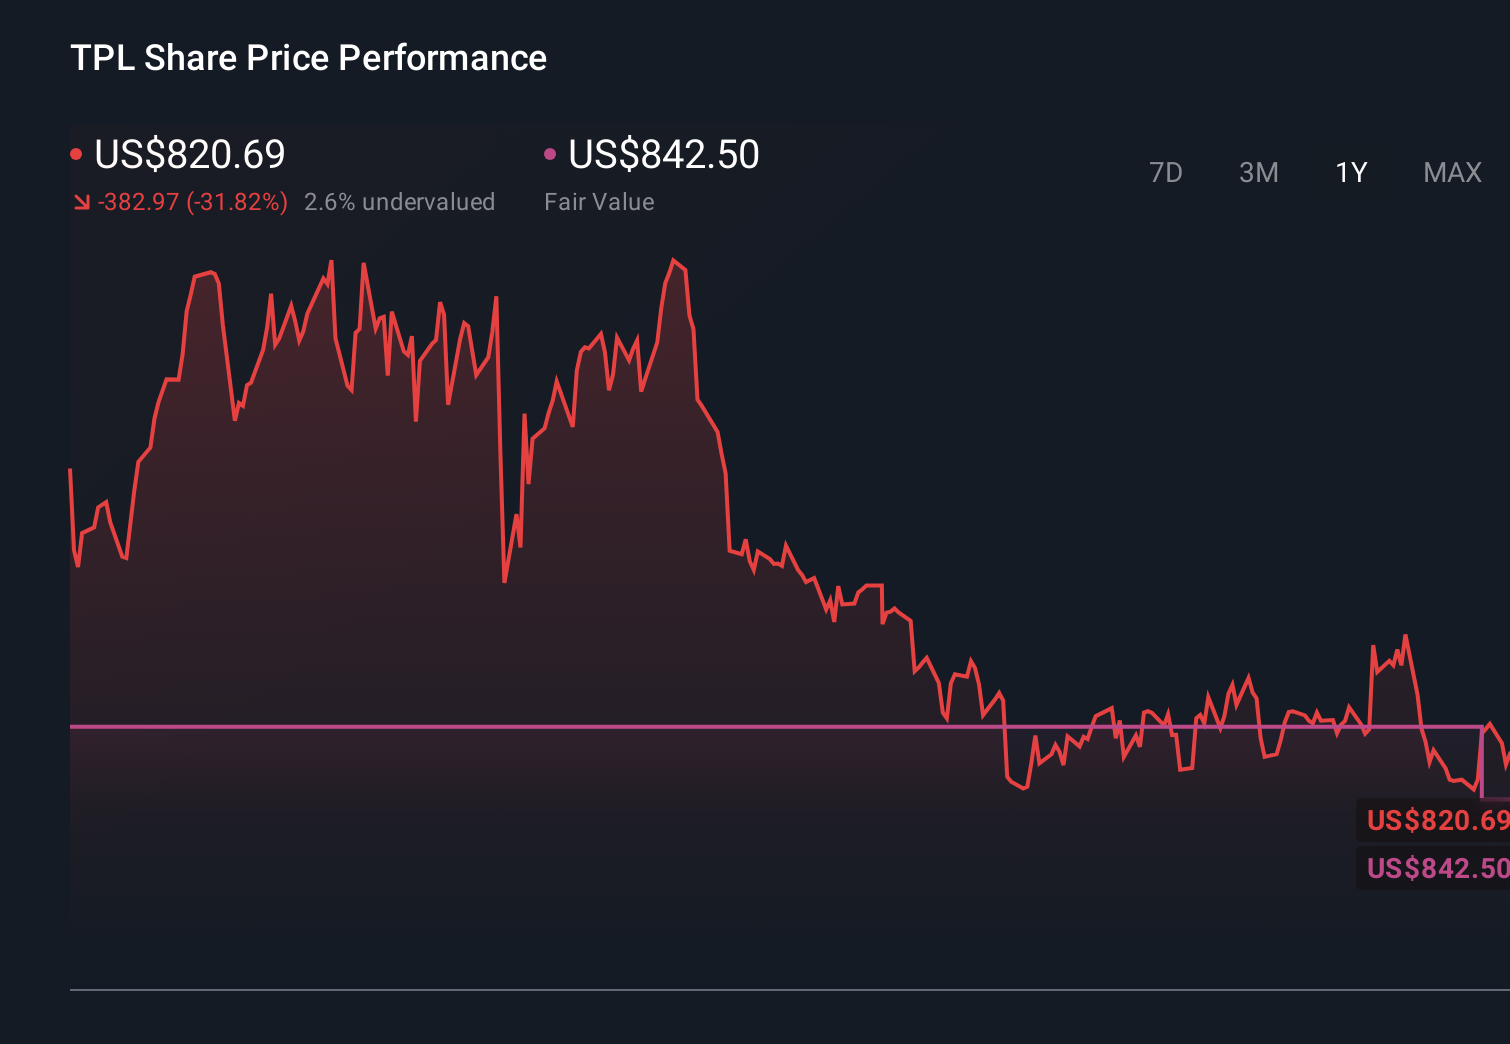
- The stock has returned 4.5% over the last 7 days and 16.3% over the last 30 days. Year to date it is up 16.0%, but it shows a 25.7% decline over the last year and a 53.9% return over 3 years, with a very large 5 year return of about 3x.
- Recent coverage of Texas Pacific Land has focused on its role as an energy related land and royalty business, along with ongoing investor interest in how its asset base and business model line up with current market conditions. This context has helped frame recent share price moves, as investors weigh long term value against shorter term swings in sentiment.
- On our valuation framework, Texas Pacific Land currently scores 0 out of 6 on undervaluation checks. Next we will look at how different valuation methods assess the stock, then finish with a more holistic way to think about value that goes beyond a simple score.
Texas Pacific Land scores just 0/6 on our valuation checks. See what other red flags we found in the full valuation breakdown.
Approach 1: Texas Pacific Land Discounted Cash Flow (DCF) Analysis
A Discounted Cash Flow, or DCF, model takes estimates of the cash a business could generate in the future and discounts those cash flows back into today’s dollars, aiming to estimate what the whole company might be worth right now.
For Texas Pacific Land, the model uses last twelve month Free Cash Flow of about $370.7 million and a 2 Stage Free Cash Flow to Equity approach. Analysts provide explicit forecasts for the next few years, with $608 million projected for 2026 and $692 million for 2027. Beyond that, Simply Wall St extrapolates cash flows out to 2035, reaching a projected $1,071.6 million in that year, with each future figure discounted back to today using the model’s assumptions.
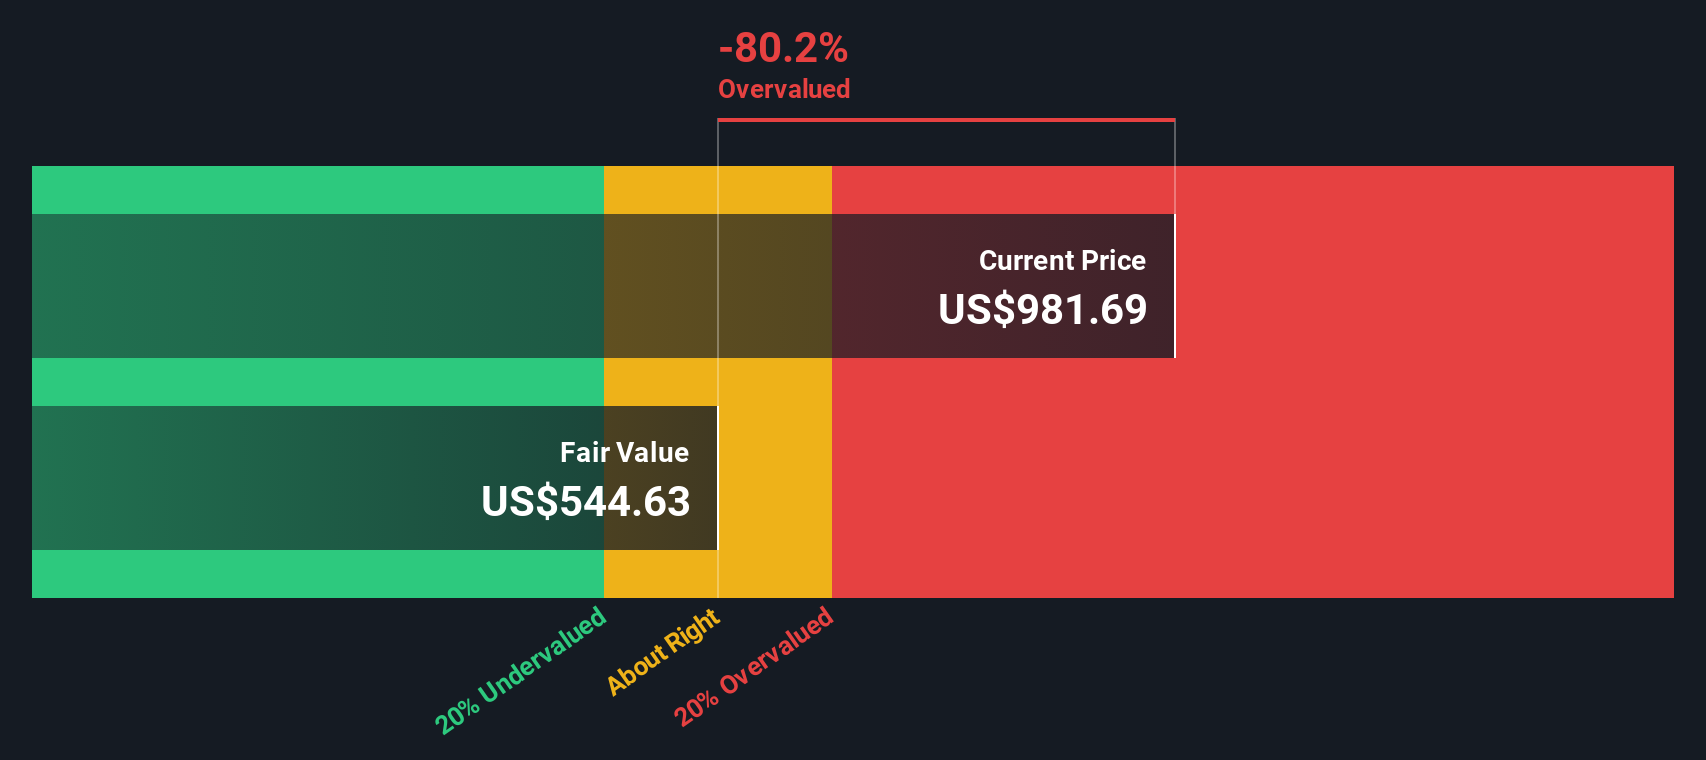
Pulling these cash flow projections together, the DCF model estimates an intrinsic value of roughly $307.59 per share, compared with the current share price of about $345.78. That implies the shares are around 12.4% above this DCF estimate, so on this measure the stock screens as overvalued rather than cheap.
Result: OVERVALUED
Our Discounted Cash Flow (DCF) analysis suggests Texas Pacific Land may be overvalued by 12.4%. Discover 883 undervalued stocks or create your own screener to find better value opportunities.
Approach 2: Texas Pacific Land Price vs Earnings
For profitable companies, the P/E ratio is a straightforward way to gauge how much you are paying for each dollar of current earnings, which makes it a useful cross check alongside a DCF model.
A “normal” or “fair” P/E ratio tends to be higher when investors expect stronger earnings growth or see lower risk, and lower when growth expectations are modest or risks look higher, so context really matters.
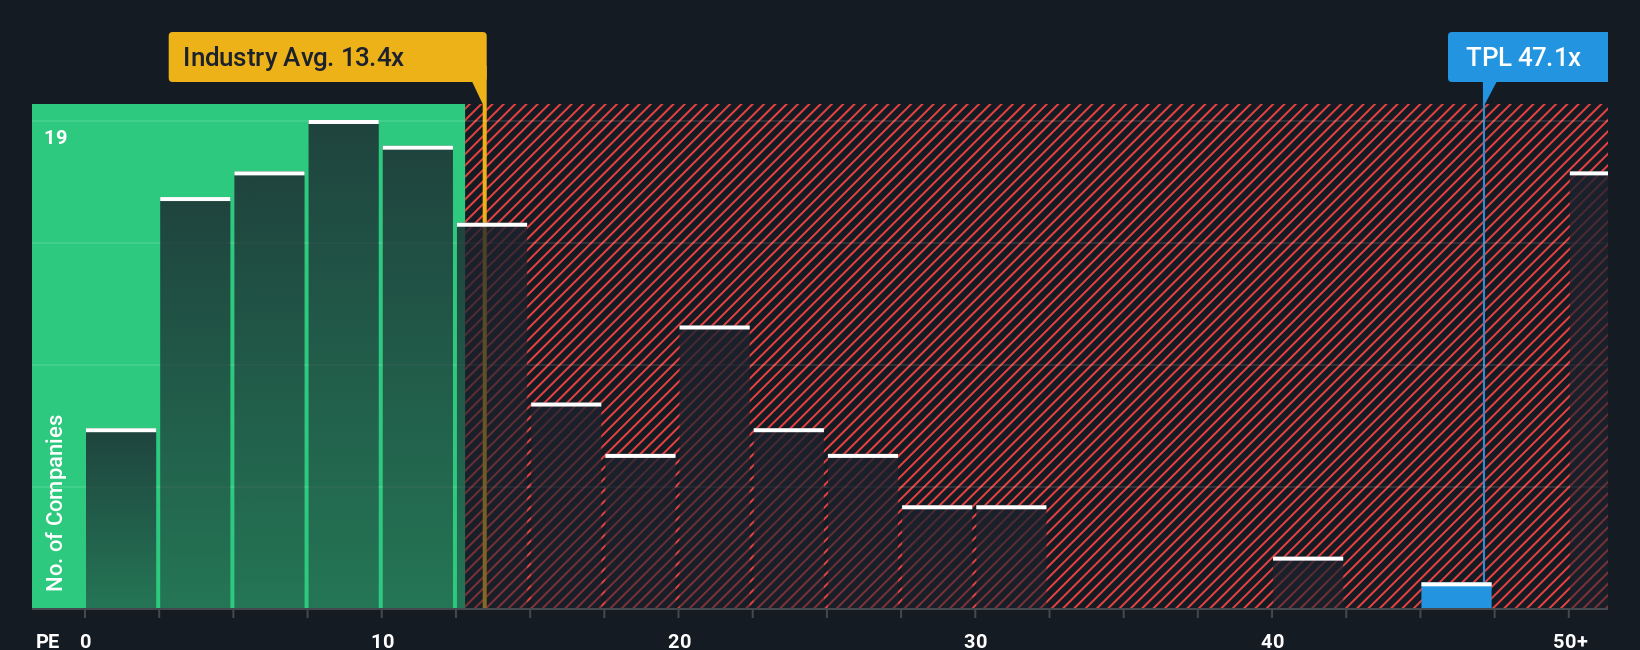
Texas Pacific Land is currently trading on a P/E of about 50.0x. That sits well above the Oil and Gas industry average P/E of roughly 13.5x and also above the peer group average of about 14.9x, so on simple comparisons the shares look expensive.
Simply Wall St’s Fair Ratio is a proprietary estimate of what P/E might be reasonable for this company, given factors such as its earnings growth profile, profit margins, industry, market capitalization and risk characteristics. Because it incorporates these fundamentals, the Fair Ratio can be more informative than a plain comparison with industry or peer averages that treat all companies as if they are the same.
For Texas Pacific Land, the Fair Ratio is 18.7x, which is well below the current 50.0x P/E, suggesting the shares are pricing in a lot more than this model would imply.
Result: OVERVALUED
P/E ratios tell one story, but what if the real opportunity lies elsewhere? Discover 1431 companies where insiders are betting big on explosive growth.
Upgrade Your Decision Making: Choose your Texas Pacific Land Narrative
Earlier we mentioned that there is an even better way to understand valuation, so let us introduce you to Narratives, which are simply your story about a company linked directly to your own assumptions for future revenue, earnings, margins and a fair value estimate.
On Simply Wall St, Narratives live on the Community page and are easy to use. You adjust a few key assumptions, see how that flows into a financial forecast, and the platform connects that forecast to a Fair Value that you can compare with the current share price to help you decide how you want to approach the stock.
Because Narratives are refreshed when new information like earnings releases or significant news is added to the platform, your story about Texas Pacific Land and its Fair Value can update alongside the latest data without you rebuilding your analysis from scratch.
For example, one Texas Pacific Land Narrative on the Community page might assume relatively conservative growth and a lower Fair Value than today’s price. Another might assume stronger long term revenue and margin assumptions that support a higher Fair Value, showing how different investors can look at the same company yet reach very different conclusions.
Do you think there's more to the story for Texas Pacific Land? Head over to our Community to see what others are saying!
This article by Simply Wall St is general in nature. We provide commentary based on historical data and analyst forecasts only using an unbiased methodology and our articles are not intended to be financial advice. It does not constitute a recommendation to buy or sell any stock, and does not take account of your objectives, or your financial situation. We aim to bring you long-term focused analysis driven by fundamental data. Note that our analysis may not factor in the latest price-sensitive company announcements or qualitative material. Simply Wall St has no position in any stocks mentioned.