Is It Time To Reassess TPG (TPG) After A 26% One Month Share Price Slide
TPG Inc Class A TPG | 0.00 |
- If you are wondering whether TPG’s share price reflects its underlying worth right now, you are not alone. This article is here to frame the key valuation questions you might be asking.
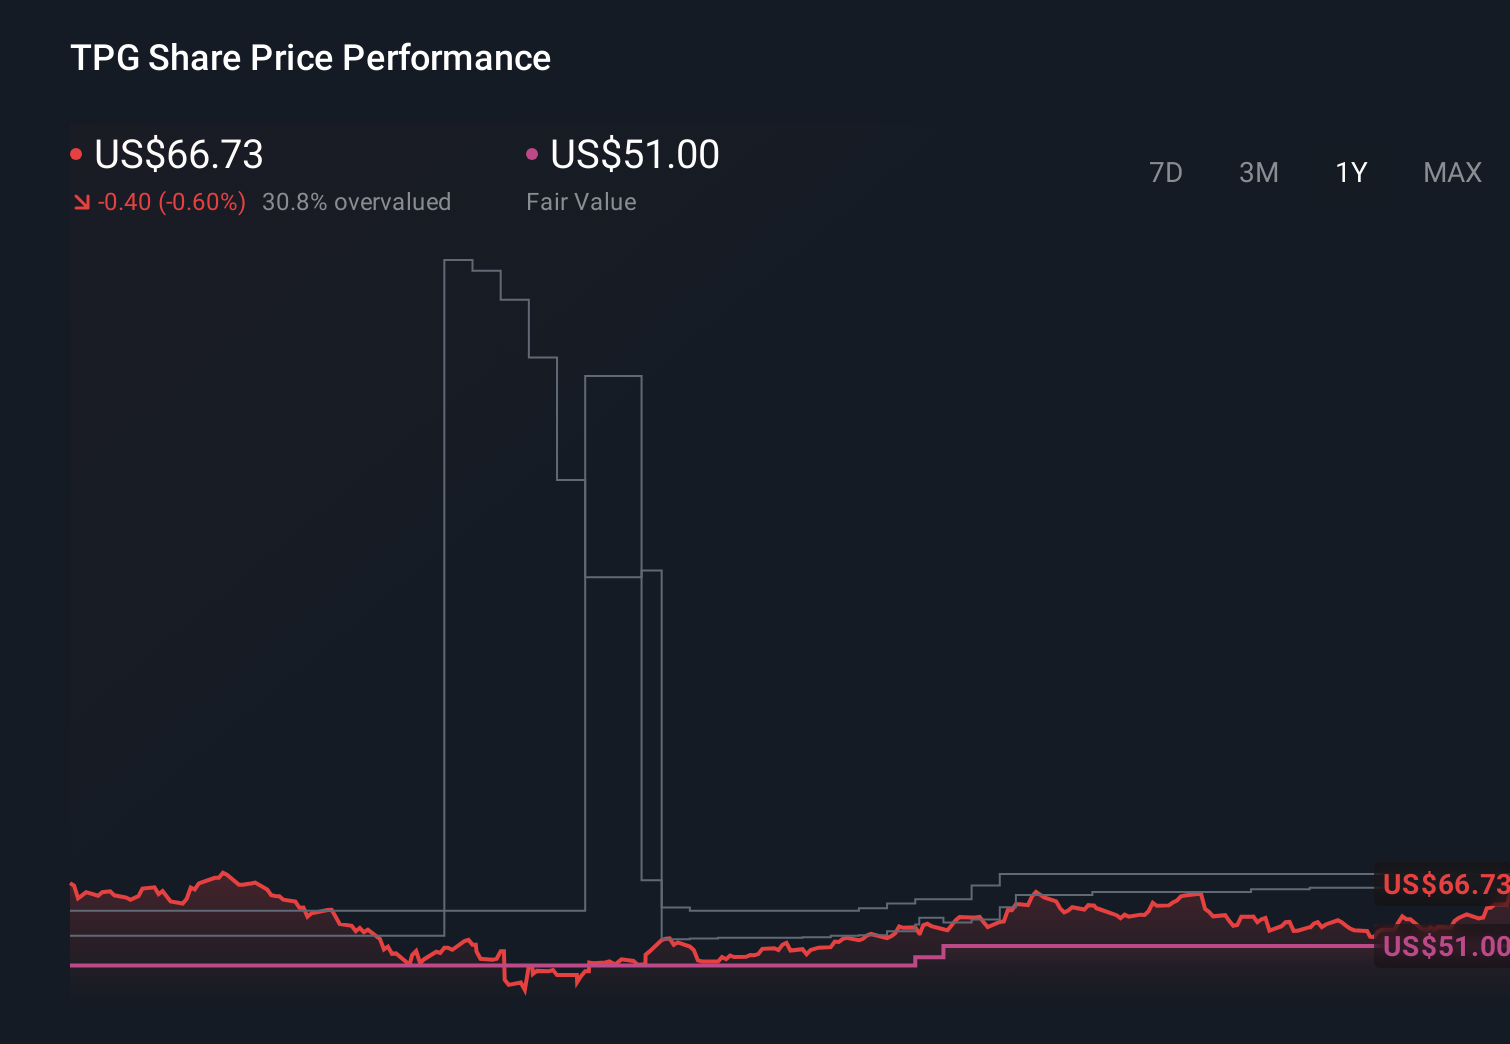
- After reaching a recent close of US$49.53, the stock has seen a 10% decline over the last 7 days and a 26.2% decline over the last 30 days, while still showing a 64.5% return over 3 years and mixed results over shorter periods including year to date and the last 12 months.
- Recent news coverage around TPG has focused on its position as a listed alternative asset manager and how investor sentiment toward that part of the market can shift quickly as interest rate expectations, fund flows or deal activity change. These themes help explain why the share price can move sharply over shorter time frames even when the underlying business story takes longer to play out.
- Right now, TPG’s valuation score stands at 2 out of 6. This suggests some checks indicate potential undervaluation while others do not. Next we will walk through the main valuation approaches investors often use before coming back to a more complete way of thinking about value at the end of the article.
TPG scores just 2/6 on our valuation checks. See what other red flags we found in the full valuation breakdown.
Approach 1: TPG Excess Returns Analysis
The Excess Returns model looks at how much profit a company can generate over and above the return that shareholders require. Instead of focusing on near term earnings, it asks whether each dollar of equity in the business is expected to earn more than its cost over time.
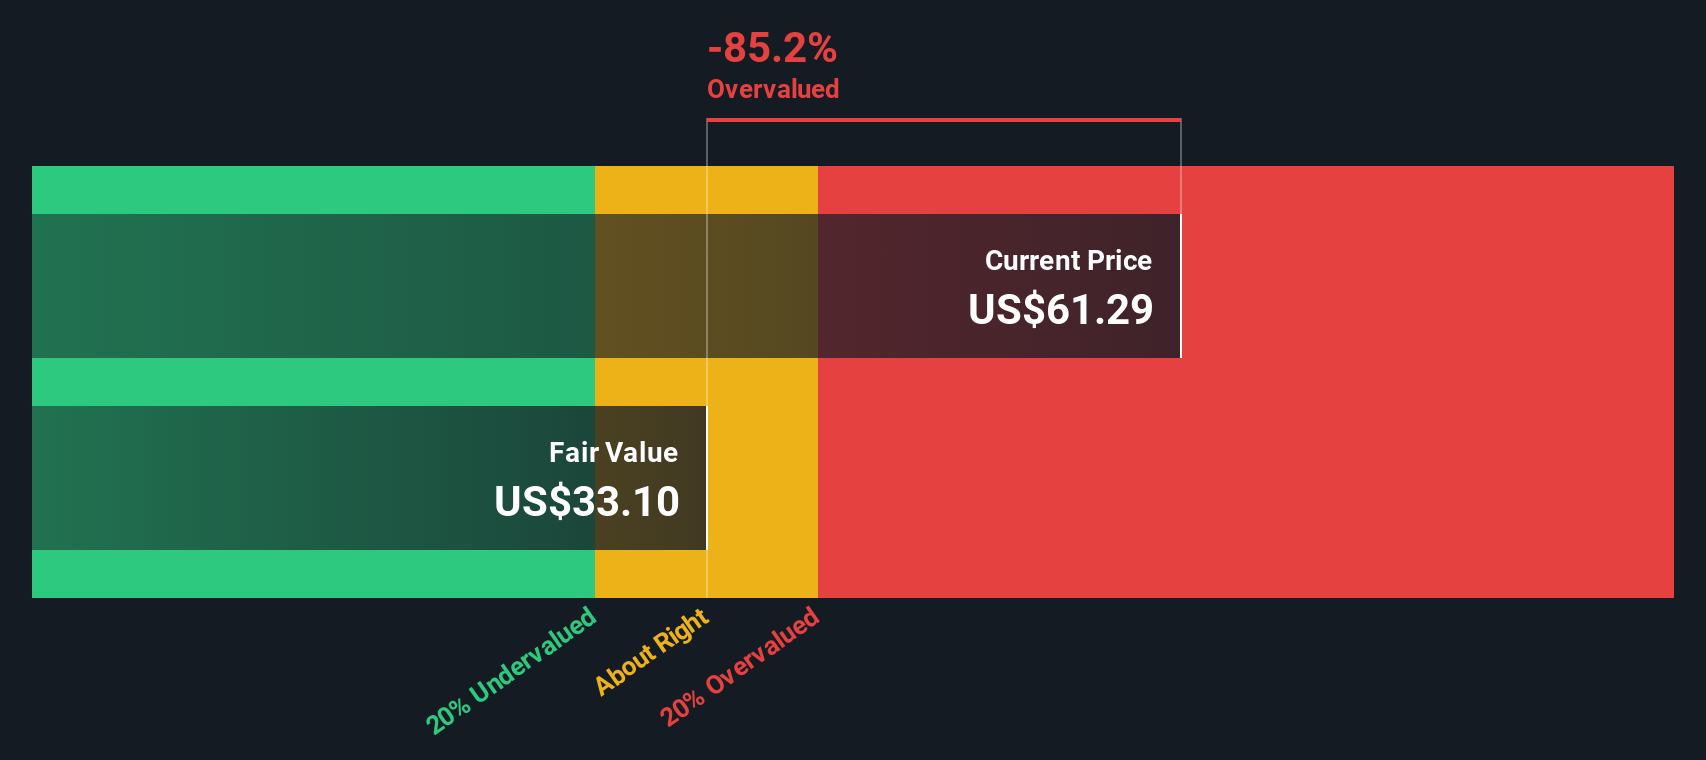
For TPG, the model uses a Book Value of $7.71 per share and a Stable EPS of $2.73 per share, based on weighted future Return on Equity estimates from 4 analysts. The Average Return on Equity is 33.75%, compared with a Cost of Equity of $0.65 per share. That gap leads to an estimated Excess Return of $2.08 per share, suggesting the business is expected to earn more on its equity base than the required return. The Stable Book Value used in the model is $8.08 per share, sourced from weighted future Book Value estimates from 2 analysts.
Putting these inputs together, the Excess Returns model arrives at an intrinsic value of about $52.96 per share, which is roughly 6.5% above the recent share price of $49.53. On this framework, TPG appears slightly undervalued rather than obviously cheap or expensive.
Result: ABOUT RIGHT
TPG is fairly valued according to our Excess Returns, but this can change at a moment's notice. Track the value in your watchlist or portfolio and be alerted on when to act.
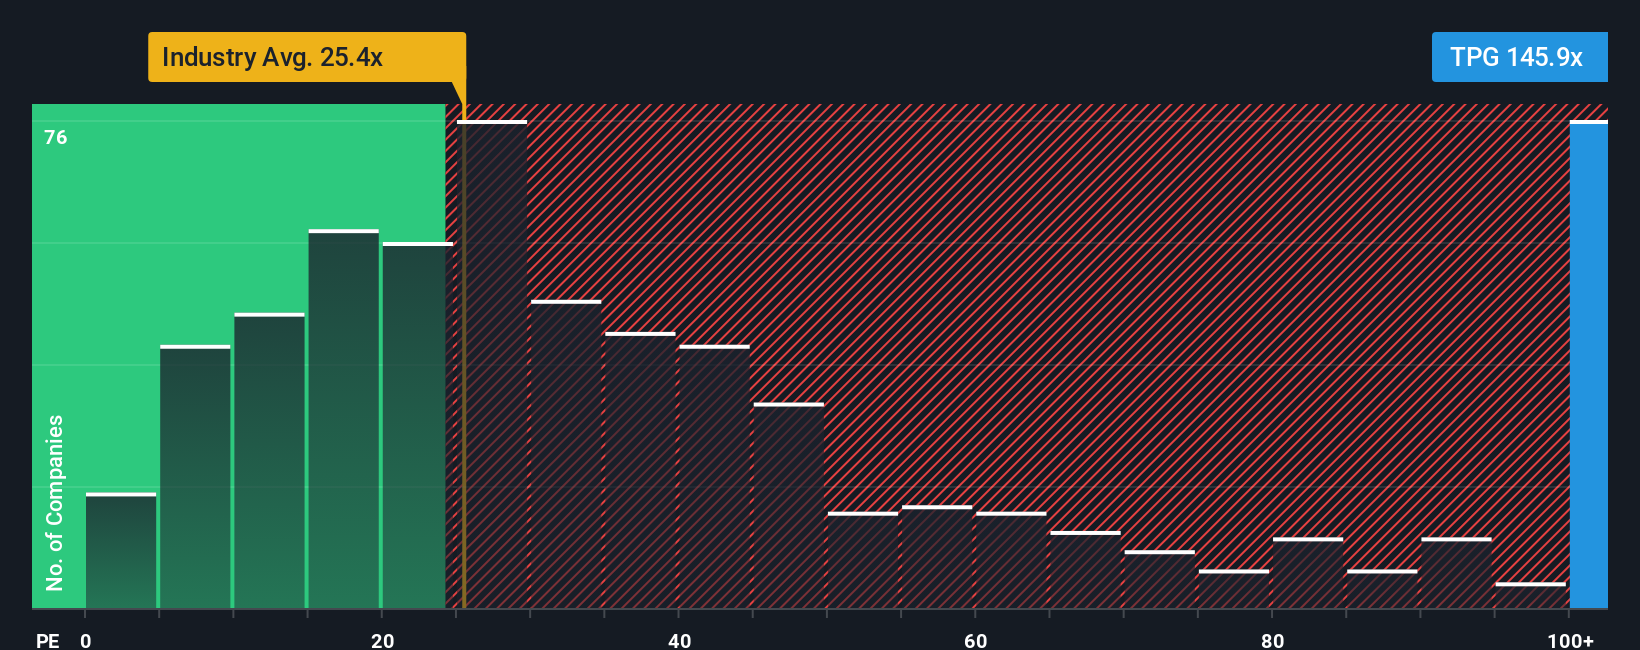
Approach 2: TPG Price vs Earnings
For a profitable company like TPG, the P/E ratio is a straightforward way to connect what you pay today with the earnings the business is currently generating. It gives you a quick sense of how many dollars investors are willing to pay for each dollar of earnings.
What counts as a reasonable P/E depends a lot on how the market views growth potential and risk. Higher expected earnings growth or lower perceived risk can support a higher P/E, while slower growth or higher uncertainty usually lines up with a lower P/E.
TPG currently trades on a P/E of 41.08x. That sits above the Capital Markets industry average of 23.12x and the peer average of 38.52x. Simply Wall St also provides a proprietary “Fair Ratio” for TPG of 24.15x. This is the P/E level it estimates based on factors like earnings growth, industry, profit margins, market cap and specific risks.
This Fair Ratio can be more useful than a simple peer or industry comparison because it tailors the expected multiple to TPG’s own profile instead of assuming one size fits all. With the current P/E of 41.08x sitting well above the Fair Ratio of 24.15x, the stock screens as trading richer than that model would suggest.
Result: OVERVALUED
P/E ratios tell one story, but what if the real opportunity lies elsewhere? Start investing in legacies, not executives. Discover our 23 top founder-led companies.
Upgrade Your Decision Making: Choose your TPG Narrative
Earlier we mentioned that there is an even better way to understand valuation, so let us introduce you to Narratives. This is a simple tool on Simply Wall St's Community page that lets you connect your view of TPG’s story with a set of numbers, link that story to a forecast for revenue, earnings and margins, and then compare your own Fair Value to the current share price. You can also see how other investors can reasonably land at very different outcomes, such as a lower US$46 fair value or a higher US$82 fair value. Narratives update automatically as new news or earnings arrive so your buy or sell decisions always sit on top of the latest information.
Do you think there's more to the story for TPG? Head over to our Community to see what others are saying!
This article by Simply Wall St is general in nature. We provide commentary based on historical data and analyst forecasts only using an unbiased methodology and our articles are not intended to be financial advice. It does not constitute a recommendation to buy or sell any stock, and does not take account of your objectives, or your financial situation. We aim to bring you long-term focused analysis driven by fundamental data. Note that our analysis may not factor in the latest price-sensitive company announcements or qualitative material. Simply Wall St has no position in any stocks mentioned.