Is It Time To Reassess VF Corp (VFC) After Brand Portfolio Shake Up And Price Slide
V.F. Corporation VFC | 16.87 | -0.30% |
- If you are wondering whether V.F at around US$20.51 is a bargain or a value trap, you are not alone. This article walks through what the current price could mean for long term investors.
- The stock has returned 2.5% over the last 7 days and 12.9% over the last month. However, the 1 year return of a 14.8% decline and the 70.3% decline over 5 years show a very different picture for longer term holders.
- Recent attention on V.F has focused on how the company is repositioning its brand portfolio and responding to changing consumer demand, alongside board and management changes that investors are watching closely. These developments help frame the recent share price moves and set the context for thinking about what the stock might be worth today.
- Right now V.F scores 1 out of 6 on our valuation checks, which you can see in detail here. Next we will look at what different valuation approaches say about that score, before finishing with a way to interpret valuation that goes beyond just a single number.
V.F scores just 1/6 on our valuation checks. See what other red flags we found in the full valuation breakdown.
Approach 1: V.F Discounted Cash Flow (DCF) Analysis
The Discounted Cash Flow model projects the cash V.F could generate in the future and then discounts those cash flows back to today to estimate what the business might be worth per share.
For V.F, the model starts with last twelve month Free Cash Flow of about $303.7 million and applies a 2 Stage Free Cash Flow to Equity approach. Analysts provide explicit forecasts for the next few years, then Simply Wall St extrapolates those out, resulting in projected Free Cash Flow of about $1.1 billion in 2035, all in $.
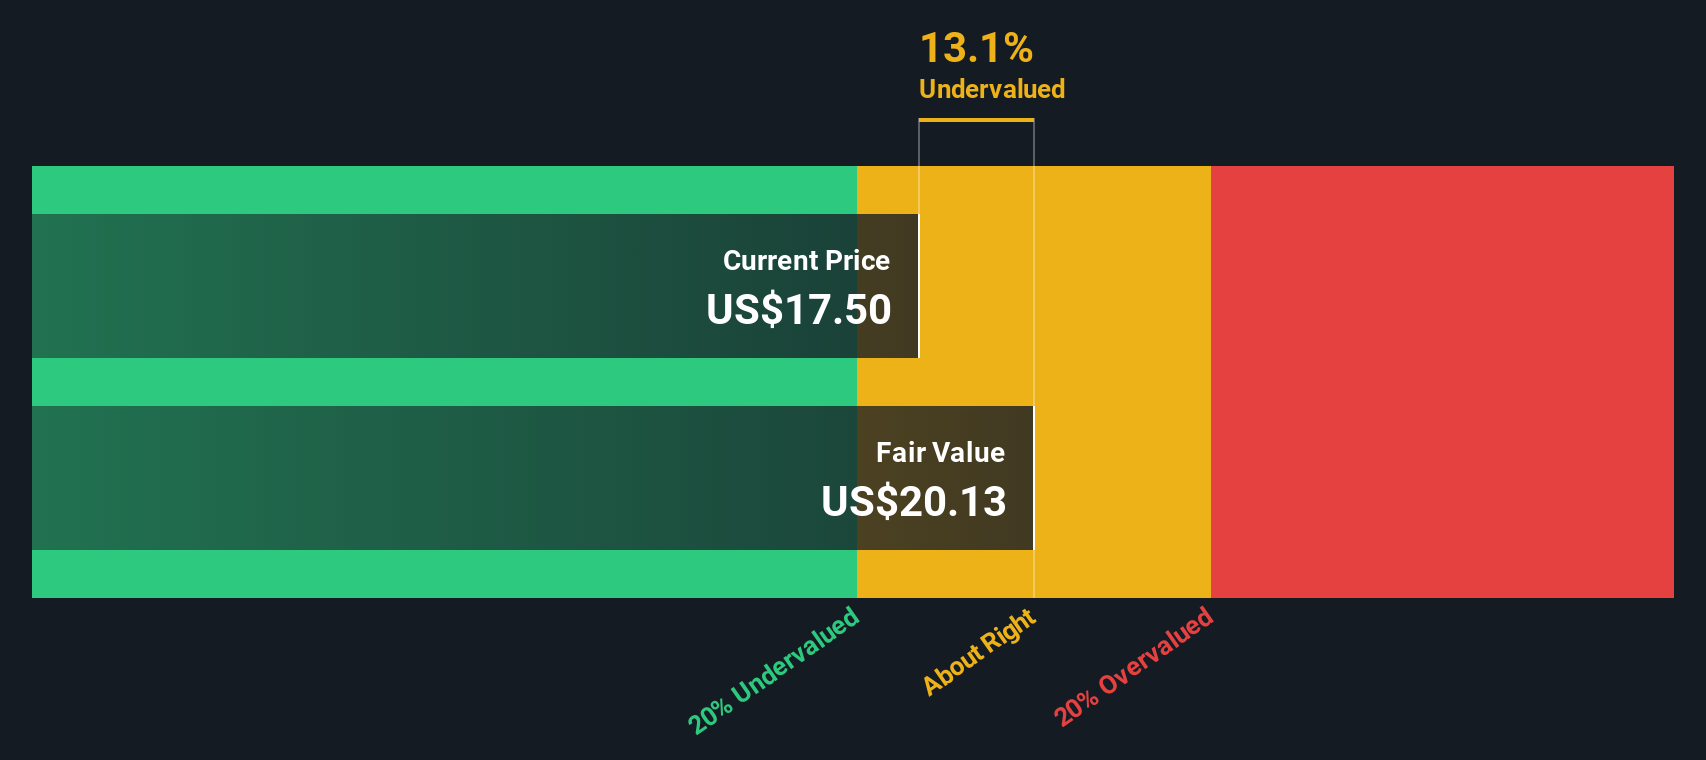
After discounting each year's projected cash flow to today, the DCF model arrives at an estimated intrinsic value of about $24.28 per share. Compared to the recent share price of around $20.51, this implies V.F trades at roughly a 15.5% discount to that DCF estimate, which points to the shares looking undervalued on this model alone.
Result: UNDERVALUED
Our Discounted Cash Flow (DCF) analysis suggests V.F is undervalued by 15.5%. Track this in your watchlist or portfolio, or discover 876 more undervalued stocks based on cash flows.
Approach 2: V.F Price vs Earnings
For a company that is generating earnings, the P/E ratio is a useful way to think about what you are paying for each dollar of profit. Investors usually accept a higher P/E when they expect stronger earnings growth or see lower risk, and a lower P/E when growth expectations are weaker or risks feel higher.
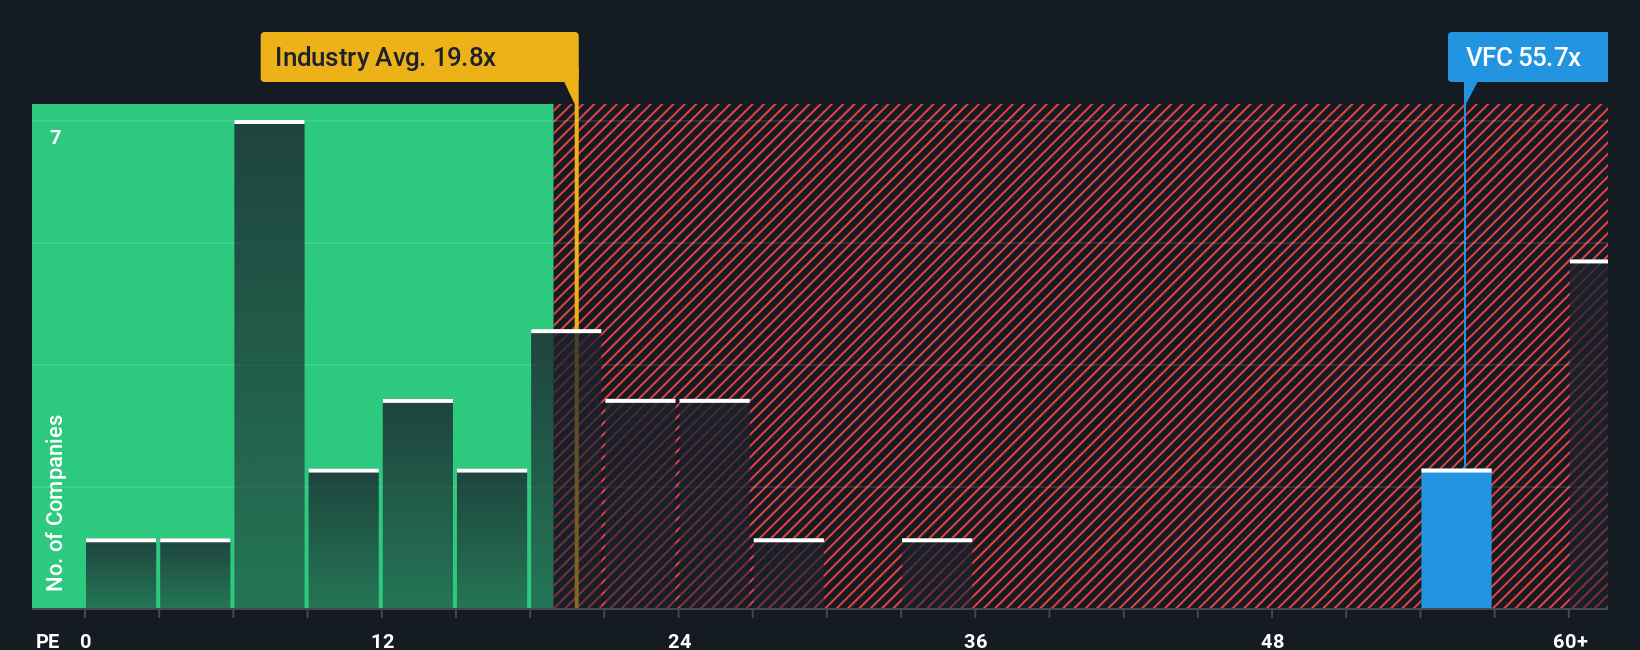
V.F currently trades on a P/E of about 35.8x. That sits above the Luxury industry average of around 18.8x and also above the peer group average of roughly 13.8x. On those simple comparisons, the shares look more expensive than many similar companies.
Simply Wall St also calculates a “Fair Ratio”, which is the P/E level that might make sense for V.F given factors like its earnings growth profile, industry, profit margin, market cap and risk characteristics. This Fair Ratio for V.F is about 25.1x, which aims to be more tailored than broad industry or peer comparisons because it pulls all of those elements together rather than looking at just one dimension. Compared to the current P/E of 35.8x, V.F screens as overvalued on this multiple based approach.
Result: OVERVALUED
P/E ratios tell one story, but what if the real opportunity lies elsewhere? Discover 1425 companies where insiders are betting big on explosive growth.
Upgrade Your Decision Making: Choose your V.F Narrative
Earlier we mentioned that there is an even better way to understand what a stock might be worth, so let us introduce you to Narratives, a simple way to connect your view of V.F’s story to your own numbers for future revenue, earnings, margins and an assumed fair value.
A Narrative is your version of the V.F story written in numbers. You start with what you believe about its brands, competitive position and execution, then link that to a forecast and a fair value that you can compare directly with today’s share price.
On Simply Wall St, Narratives sit inside the Community page and are used by millions of investors. You can quickly see how different fair values line up against the current price, which can help you decide whether V.F looks closer to a buy, a hold or a sell for your own approach.
These Narratives update automatically when new information such as earnings releases or major news is added to the platform, so the fair values and supporting forecasts stay aligned with the latest data instead of remaining static.
For example, one V.F Narrative might assume a much higher fair value based on confidence in a brand refresh. Another assigns a lower fair value because it places more weight on recent share price weakness and business challenges.
Do you think there's more to the story for V.F? Head over to our Community to see what others are saying!

This article by Simply Wall St is general in nature. We provide commentary based on historical data and analyst forecasts only using an unbiased methodology and our articles are not intended to be financial advice. It does not constitute a recommendation to buy or sell any stock, and does not take account of your objectives, or your financial situation. We aim to bring you long-term focused analysis driven by fundamental data. Note that our analysis may not factor in the latest price-sensitive company announcements or qualitative material. Simply Wall St has no position in any stocks mentioned.