Is It Time To Reassess W. R. Berkley (WRB) After Mixed Share Price Performance?
W. R. Berkley Corporation WRB | 0.00 |
Before looking at the numbers behind W. R. Berkley, it helps to ask a simple question: at around US$66.38 per share, are you looking at a stock that is priced fairly or one that the market might be misjudging?
Recent returns are mixed, with the stock up 0.3% over the last week and 0.6% over the last month, while year to date it is down 4.3% and over the past year it has returned 6.0% less, compared to gains of 82.2% over three years and 108.0% over five years.
Alongside these moves, investors have been reacting to broader insurance sector headlines and macro themes that affect underwriting conditions and investment returns, which can quickly change how the market prices risk for insurers like W. R. Berkley. Sector commentary around interest rates, pricing cycles in commercial insurance and capital requirements has been especially important in shaping sentiment.
Simply Wall St currently assigns W. R. Berkley a valuation score of 2 out of 6, which reflects how many of its checks indicate the stock may be undervalued. The rest of this article will walk through what that means using common valuation approaches, before finishing with a more holistic way to think about value that puts all these signals into context.
W. R. Berkley scores just 2/6 on our valuation checks. See what other red flags we found in the full valuation breakdown.
Approach 1: W. R. Berkley Excess Returns Analysis
The Excess Returns model looks at how much value W. R. Berkley creates over and above the return that shareholders require. It focuses on what the company earns on its equity versus its cost of equity, then capitalizes that “extra” return into an estimate of intrinsic value per share.
For W. R. Berkley, the model uses a Book Value of US$25.72 per share and a Stable EPS of US$5.43 per share, based on weighted future Return on Equity estimates from 11 analysts. The estimated Cost of Equity is US$2.13 per share, which implies an Excess Return of about US$3.30 per share.
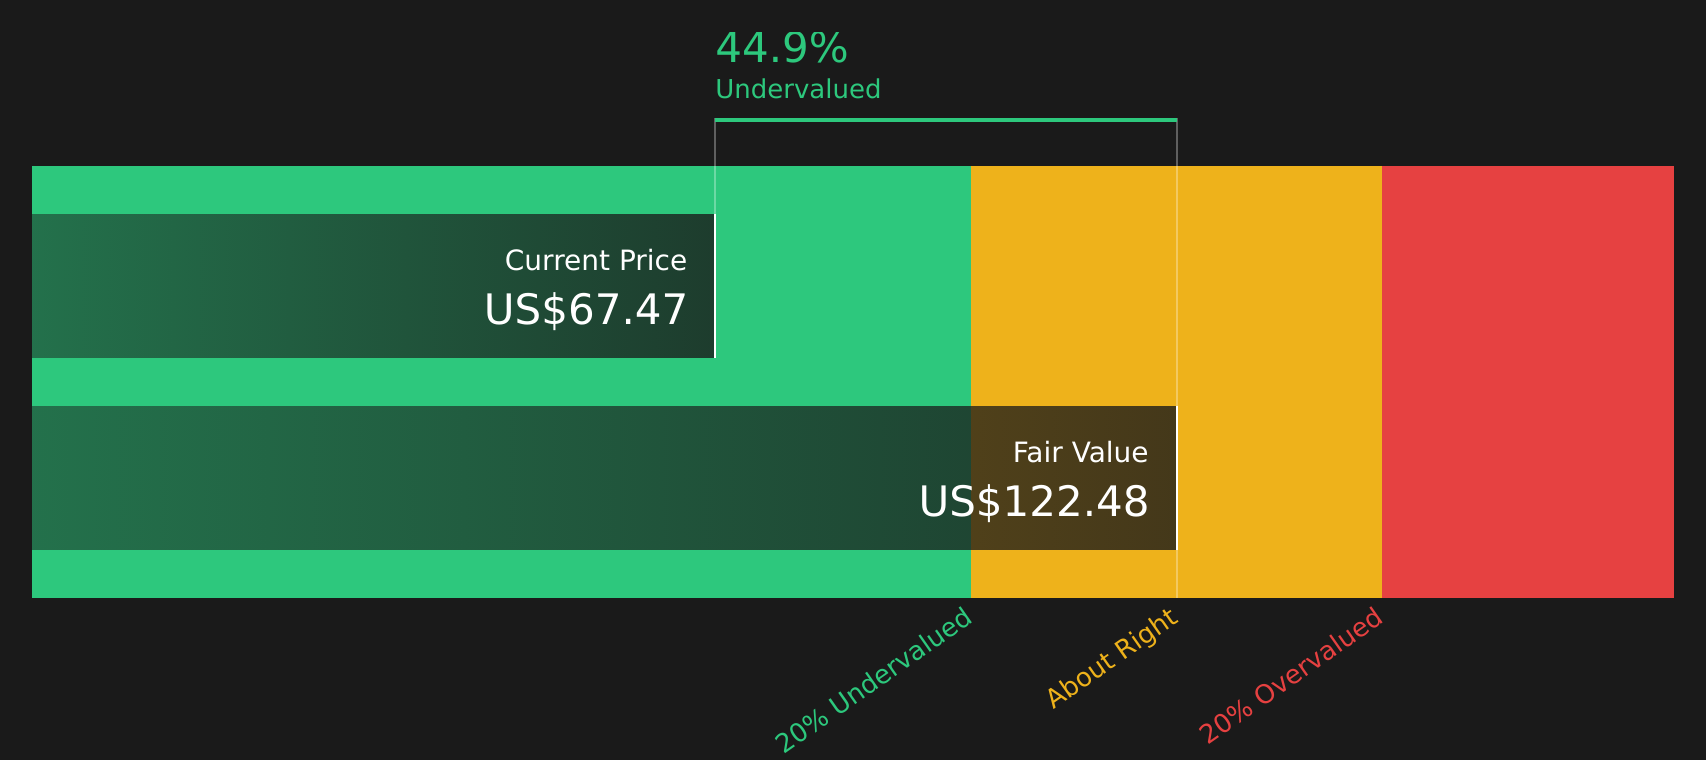
An Average Return on Equity of 17.77% is paired with a Stable Book Value of US$30.57 per share, based on weighted future Book Value estimates from 9 analysts. Together, these inputs are used to project future excess returns and discount them to reach an intrinsic value estimate of about US$123.00 per share.
Compared with the current share price of around US$66.38, this Excess Returns estimate indicates the stock may be trading at a sizeable discount, around 46.0% below that intrinsic value estimate.
Result: UNDERVALUED
Our Excess Returns analysis suggests W. R. Berkley is undervalued by 46.0%. Track this in your watchlist or portfolio, or discover 51 more high quality undervalued stocks.
Approach 2: W. R. Berkley Price vs Earnings
For a profitable company, the P/E ratio is a useful shorthand because it links what you pay for the stock to the earnings it currently generates. It helps you see how many dollars investors are paying today for each dollar of earnings.
What counts as a “normal” P/E depends a lot on how the market views a company’s growth prospects and risk. Higher expected growth or lower perceived risk can justify a higher multiple, while slower growth or higher risk usually lines up with a lower multiple.
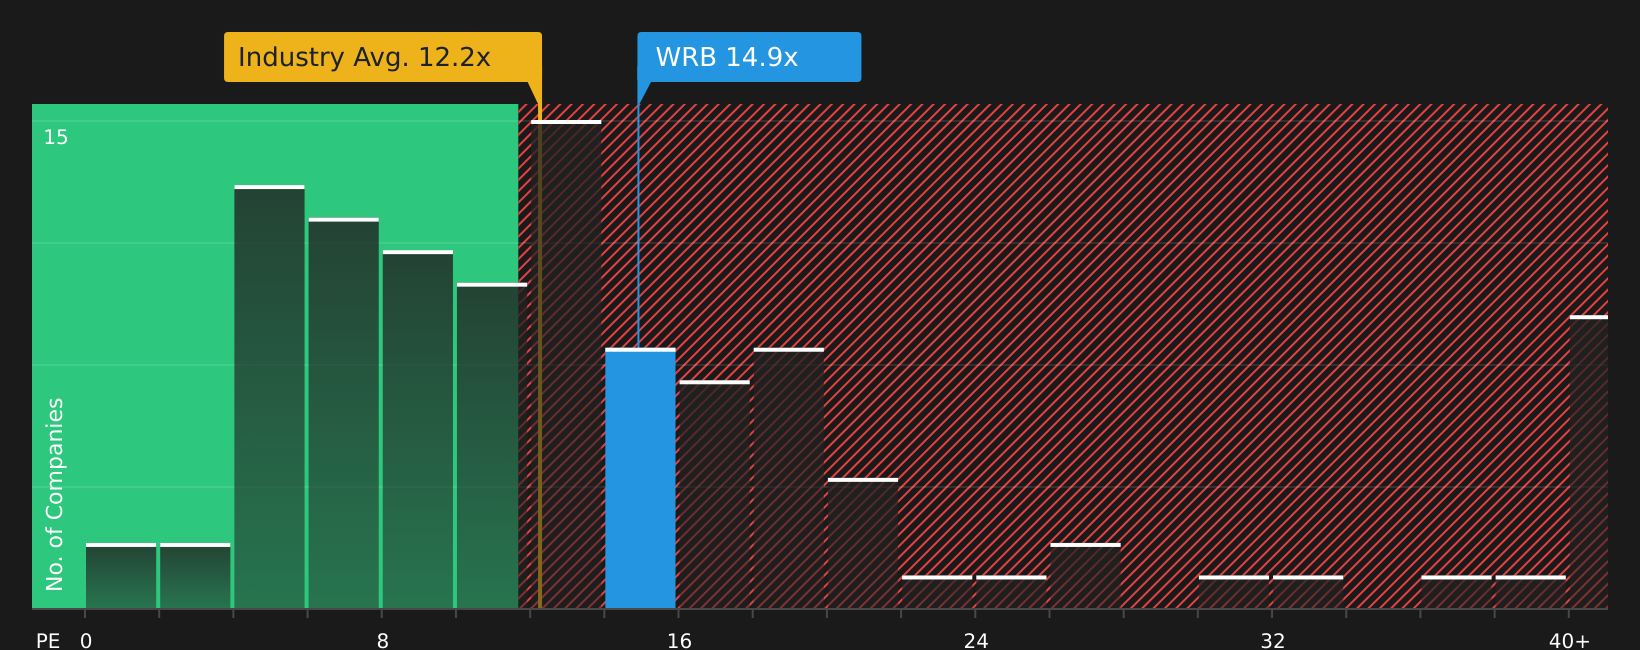
W. R. Berkley currently trades on a P/E of 13.17x. That sits above the Insurance industry average of 11.45x and the peer average of 11.21x, suggesting the stock is pricing in stronger characteristics than the typical insurer. Simply Wall St’s Fair Ratio for W. R. Berkley is 11.31x, which is a proprietary estimate of what the P/E might be based on factors such as earnings growth, profit margins, industry, market cap and company specific risks. This Fair Ratio can be more informative than a simple peer or industry comparison because it adjusts for those company level features rather than treating all insurers as alike. Since the current 13.17x P/E is meaningfully above the 11.31x Fair Ratio, the stock screens as trading richer than that Fair Ratio implies.
Result: OVERVALUED
P/E ratios tell one story, but what if the real opportunity lies elsewhere? Start investing in legacies, not executives. Discover our 17 top founder-led companies.
Upgrade Your Decision Making: Choose your W. R. Berkley Narrative
Earlier it was mentioned that there is an even better way to understand valuation, so Narratives are worth introducing as a simple way for you to tell a story about W. R. Berkley that links your view of its business to a forecast and then to a Fair Value that can be compared with the current price.
On Simply Wall St’s Community page, Narratives let you set assumptions for future revenue, earnings and margins, then connect those numbers to a Fair Value that updates automatically when fresh information such as news or earnings is added.
This helps you decide whether W. R. Berkley looks more attractive or less attractive at today’s share price by showing how your Fair Value compares to the market price, instead of relying only on headline ratios like the current 13.17x P/E.
For example, one investor might lean toward a cautious Narrative that is closer to a Fair Value of about US$55.34, while another might back a more optimistic Narrative nearer US$80.00. Seeing those different stories side by side makes it easier for you to decide which assumptions feel closer to your own view of the company.
For W. R. Berkley, however, we'll make it really easy for you with previews of two leading W. R. Berkley Narratives:
Each one turns the same raw data into a different story about what the stock might be worth, so you can quickly see which lens feels closer to your own view.
Fair Value: US$68.33 per share
Gap to current price: around 3.0% below this Fair Value, based on the recent US$66.38 share price
Revenue trend used in the model: about 0.81% annual decline
- Analysts building this narrative assume broadly stable revenue, slightly higher profit margins and earnings of about US$2.0b by 2028, with earnings per share of US$5.35.
- The Fair Value rests on W. R. Berkley maintaining pricing discipline in specialty lines, keeping combined ratios healthy and using its capital base to support margins and investment income.
- To line up with the consensus target, this story uses a P/E of 16.8x in 2028 and a discount rate of about 6.8%, with modest share count reduction over time.
Fair Value: US$55.34 per share
Gap to current price: around 20.0% above this Fair Value, based on the recent US$66.38 share price
Revenue trend used in the model: about 2.34% annual decline
- The more cautious analysts behind this narrative assume revenue declines of roughly 2.3% a year, flat earnings around US$1.9b and a P/E of 12.3x by 2029.
- This story focuses on competition, climate related catastrophe risk, regulatory pressure and limited international diversification as reasons the stock could warrant a lower multiple.
- Even with margin assumptions around 14.1% and ongoing buybacks, this view treats the recent share price as rich compared with a Fair Value that sits closer to the lower end of analyst targets.
If you want to see how other investors are joining the dots between these numbers and their own story for the stock, it is worth scanning the community views and stress testing your assumptions against theirs.
To see how these results tie into long-term growth, risks, and valuation, check out the full range of community narratives for W. R. Berkley on Simply Wall St. Add the company to your watchlist or portfolio so you'll be alerted when the story evolves.
Do you think there's more to the story for W. R. Berkley? Head over to our Community to see what others are saying!

This article by Simply Wall St is general in nature. We provide commentary based on historical data and analyst forecasts only using an unbiased methodology and our articles are not intended to be financial advice. It does not constitute a recommendation to buy or sell any stock, and does not take account of your objectives, or your financial situation. We aim to bring you long-term focused analysis driven by fundamental data. Note that our analysis may not factor in the latest price-sensitive company announcements or qualitative material. Simply Wall St has no position in any stocks mentioned.