Is It Time To Reconsider 3M (MMM) After PFAS Litigation Headlines And Recent Share Rebound?
3M MMM | 0.00 |
- Investors may be wondering if 3M at around US$156.85 is offering good value right now, or if the easy money has already been made.
- The stock has returned 3.4% over the last 7 days and 9.4% over the last month, while the year-to-date return is down 3.1% and the 1-year return is 8.6%, with a very large 3-year return and a 5-year return of 13.9% providing additional context to the recent price action.
- Recent headlines around 3M have focused on long-running legal and operational issues, and on how the company is reshaping its portfolio and balance sheet in response. This backdrop is important context for thinking about how the market is currently pricing the stock and why sentiment can shift quickly.
- On Simply Wall St's framework, 3M currently scores 3 out of 6 on the valuation checks. The next sections will compare what different valuation methods indicate about the stock and then conclude with a way to place those methods into a clearer big picture.
Approach 1: 3M Discounted Cash Flow (DCF) Analysis
A Discounted Cash Flow, or DCF, model estimates what a stock could be worth today by projecting future cash flows and then discounting those back into present value using a required return.
For 3M, the model used is a 2 Stage Free Cash Flow to Equity approach, based on cash flow projections in $. The latest twelve months free cash flow is about $1.79b. Analysts provide explicit forecasts for several years, and Simply Wall St then extrapolates further out, with projected free cash flow of about $5.0b in 2030. Each of these future cash flows is discounted back, using the model’s assumptions, to reflect the time value of money and investment risk.
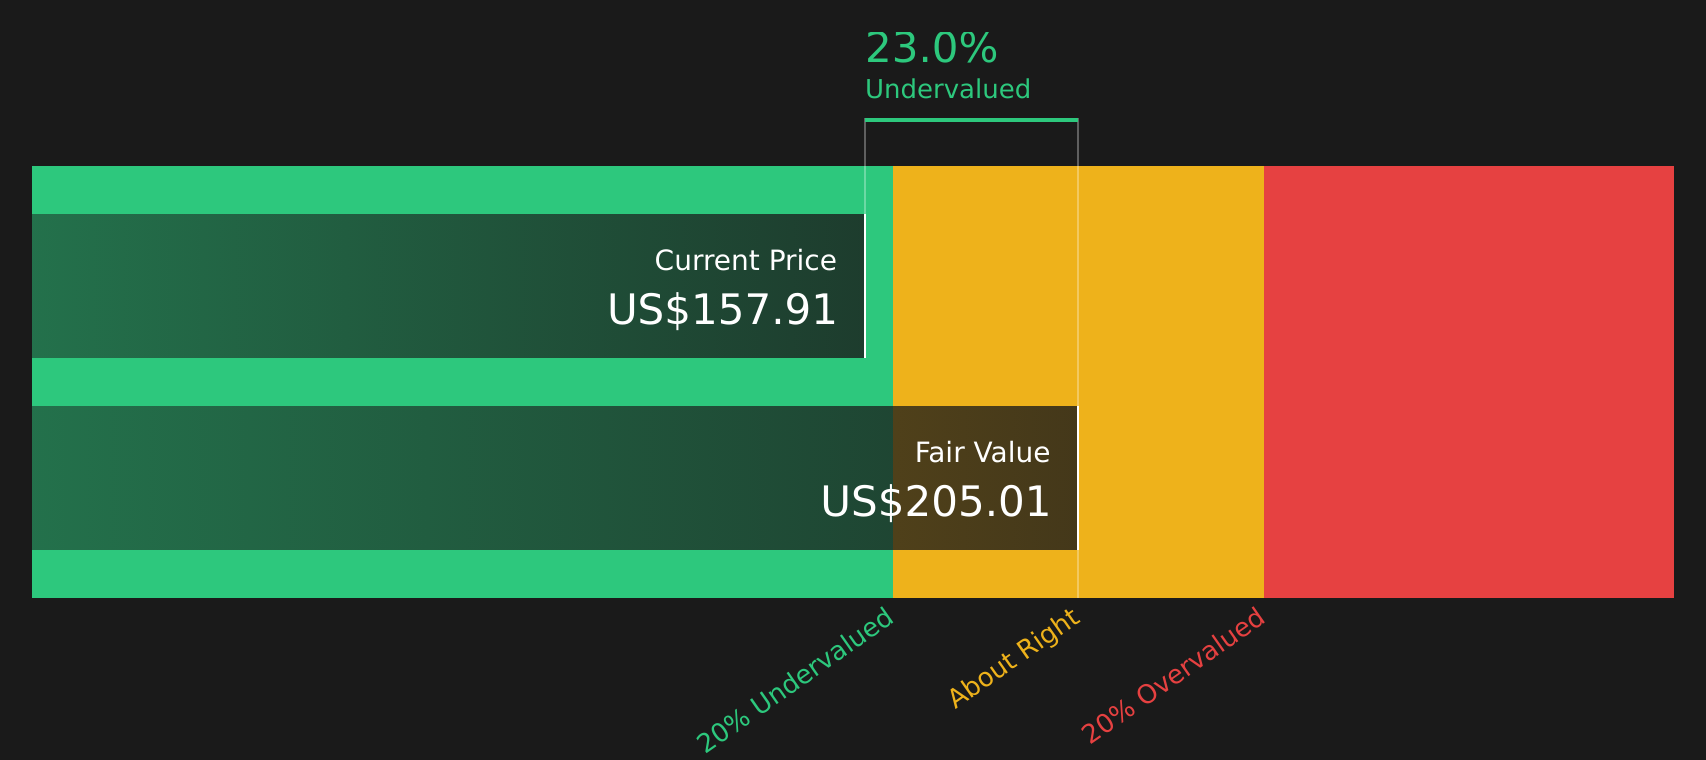
Adding up those discounted cash flows gives an estimated intrinsic value of $204.85 per share, compared with a current share price of about $156.85. On this model, that implies the stock trades at a 23.4% discount to the DCF estimate, which indicates potential undervaluation based purely on these cash flow assumptions.
Result: UNDERVALUED
Our Discounted Cash Flow (DCF) analysis suggests 3M is undervalued by 23.4%. Track this in your watchlist or portfolio, or discover 47 more high quality undervalued stocks.
Approach 2: 3M Price vs Earnings
For a profitable company like 3M, the P/E ratio is a straightforward way to relate what you pay for the stock to the earnings it currently generates. Investors usually expect higher P/E ratios when a company is perceived to have stronger growth prospects or lower risk, and lower P/E ratios when growth expectations are more modest or risks are higher.
3M currently trades on a P/E of about 29.4x. This is higher than the Industrials sector average P/E of about 12.8x, and also slightly above the peer group average of about 28.5x. On Simply Wall St’s framework, the “Fair Ratio” for 3M is 32.3x, which is an estimate of the P/E that might be expected given its earnings growth profile, industry, profit margins, market cap and risk factors.
The Fair Ratio aims to be more tailored than a simple peer or industry comparison because it adjusts for 3M’s specific characteristics rather than assuming all companies should trade on similar multiples. Comparing the Fair Ratio of 32.3x with the current P/E of 29.4x suggests that, on this metric, the stock is trading below the level implied by these inputs.
Result: UNDERVALUED

Wall Street's queuing for one rocket. While SpaceX counts down to its IPO, other companies tied to the new space race are already in orbit. → 20 Compelling Space Companies watchlist · Global Space Race Investing Ideas screener · Scan the sector by valuation on Rocket Lab's valuation page.
Upgrade Your Decision Making: Choose your 3M Narrative
Earlier it was mentioned that there is an even better way to understand valuation. This is where Narratives come in, a simple way for you to attach a clear story about 3M to concrete numbers like fair value, future revenue, earnings and margins, then see how that story stacks up against the current share price.
A Narrative is your view of what is really driving 3M, such as legal overhangs from PFAS on one side or stronger margin execution and cash returns on the other. It is linked directly to a forecast and a fair value that updates as new earnings, news or analyst revisions flow through.
On Simply Wall St, Narratives sit inside the Community page and are used by millions of investors as an accessible tool to compare their own assumed fair value with the live market price. This can help decisions about when to buy or sell be grounded in a transparent story rather than just a single ratio.
For 3M, one investor might lean toward a more cautious Narrative that lines up with a lower fair value around US$127.92, while another prefers a more optimistic Narrative closer to US$222.65. A third might sit near the consensus fair value of about US$175.03, with each Narrative helping them decide whether the current price around US$156.85 looks high, low or roughly in line with their expectations.
For 3M however we will make it really easy for you with previews of two leading 3M Narratives:
Start by asking which of these feels closer to your own view on the stock today, then use that as a base case you can adjust over time as new information comes through.
Fair value in this Narrative: about US$175.03 per share.
Implied discount to this fair value at the recent price of US$156.85: about 10.4%.
Assumed annual revenue growth: about 2.8%.
- Focus on product development, operational efficiency and higher margin mix is expected to support higher earnings and stronger profitability over time.
- Analysts in this camp factor in ongoing management of legal liabilities, steady free cash flow and share buybacks as support for the balance sheet and per share earnings.
- This view lines up with a consensus fair value near the mid US$170s, with expectations for revenue of about US$27.2b and earnings of about US$4.7b by 2029, assuming a P/E of 21.9x on those earnings.
Fair value in this Narrative: about US$127.92 per share.
Implied premium to this fair value at the recent price of US$156.85: about 22.6%.
Assumed annual revenue growth: about 1.8%.
- PFAS litigation, environmental regulation and higher compliance costs are seen as long term headwinds for free cash flow, margins and what investors may be willing to pay for the stock.
- This view expects slower revenue growth, potential pressure from restructuring and supply chain complexity, with fair value tied to a lower assumed P/E of 17.1x on 2029 earnings.
- Bearish analysts behind this Narrative anchor on a fair value in the high US$120s, which is well below the recent share price, even though their models still assume higher earnings by 2029 than today.
The two Narratives sit on the same facts but apply different weights to execution on margins, the scale of legal and regulatory risks, and how generous the future P/E should be. The most useful step now is to pressure test which set of assumptions feels more realistic for you, and then track how your chosen Narrative holds up as new data on earnings, PFAS cases and capital allocation is released.
If you want to go beyond these snapshots and see how other investors are framing the trade off between upside and risk for 3M, including detailed fair values, earnings paths and risk flags, you can review the full range of community Narratives and valuation work in one place using the To see how these results tie into long-term growth, risks, and valuation, check out the full range of community narratives for 3M on Simply Wall St. Add the company to your watchlist or portfolio so you'll be alerted when the story evolves.
Do you think there's more to the story for 3M? Head over to our Community to see what others are saying!

This article by Simply Wall St is general in nature. We provide commentary based on historical data and analyst forecasts only using an unbiased methodology and our articles are not intended to be financial advice. It does not constitute a recommendation to buy or sell any stock, and does not take account of your objectives, or your financial situation. We aim to bring you long-term focused analysis driven by fundamental data. Note that our analysis may not factor in the latest price-sensitive company announcements or qualitative material. Simply Wall St has no position in any stocks mentioned.